INTERACTIVE_TAXONOMY#
 This module is a part of metaFun pipeline, providing an interactive web interface for exploring and analyzing taxonomic profiles generated by the WMS_TAXONOMY module.
Overview#
The INTERACTIVE_TAXONOMY module offers a dynamic, web-based platform for visualizing and analyzing taxonomic data from metagenomic samples. It allows researchers to interactively explore taxonomic compositions, compare profiles across samples, and identify significant taxonomic patterns associated with metadata variables. The module leverages the Phyloseq objects created by the WMS_TAXONOMY module, enabling advanced statistical analyses and customizable visualizations without requiring programming knowledge.
This module provides an alternative to specifying the --analysiscolumn parameter in WMS_TAXONOMY, allowing users to explore different metadata variables interactively rather than determining them in advance.
Module Execution#
# Basic usage with WMS_TAXONOMY results
(metafun) metafun -module INTERACTIVE_TAXONOMY -i results/metagenome/WMS_TAXONOMY

# Specify custom port for the web interface
(metafun) metafun -module INTERACTIVE_TAXONOMY -i results/metagenome/WMS_TAXONOMY -p 8080

# Add additional metadata file
(metafun) metafun -module INTERACTIVE_TAXONOMY -i results/metagenome/WMS_TAXONOMY -m updated_metadata.csv
Running without prior analysis column specification
Even if you ran WMS_TAXONOMY without specifying an --analysiscolumn (or set it to 0), you can still perform comprehensive statistical analyses in this interactive module. This approach gives you the flexibility to explore various metadata variables without re-running the taxonomic profiling.
Module Operation Sequence#
This module performs the following steps:
Loading taxonomic data from WMS_TAXONOMY results
Reading phyloseq objects created by either Kraken2/Bracken or sylph
Integrating taxonomic profiles with sample metadata
Converting to microeco objects for enhanced analysis capabilities
Launching an interactive web server with multiple analytical modules
Composition Explorer for taxonomic visualization
Diversity Explorer for alpha and beta diversity analysis
Differential Abundance Analysis for statistical testing
Taxon Analyzer for examining specific taxa
Metadata Explorer for sample information analysis
Enabling on-demand analysis through interactive components
Dynamic filtering and selection
Statistical testing with different metadata variables
Customizable visualization options
Data export for downstream applications
Interface Components#
The web interface is divided into multiple tabs, each providing specialized tools for different types of taxonomic analysis.
Main Interface Structure#
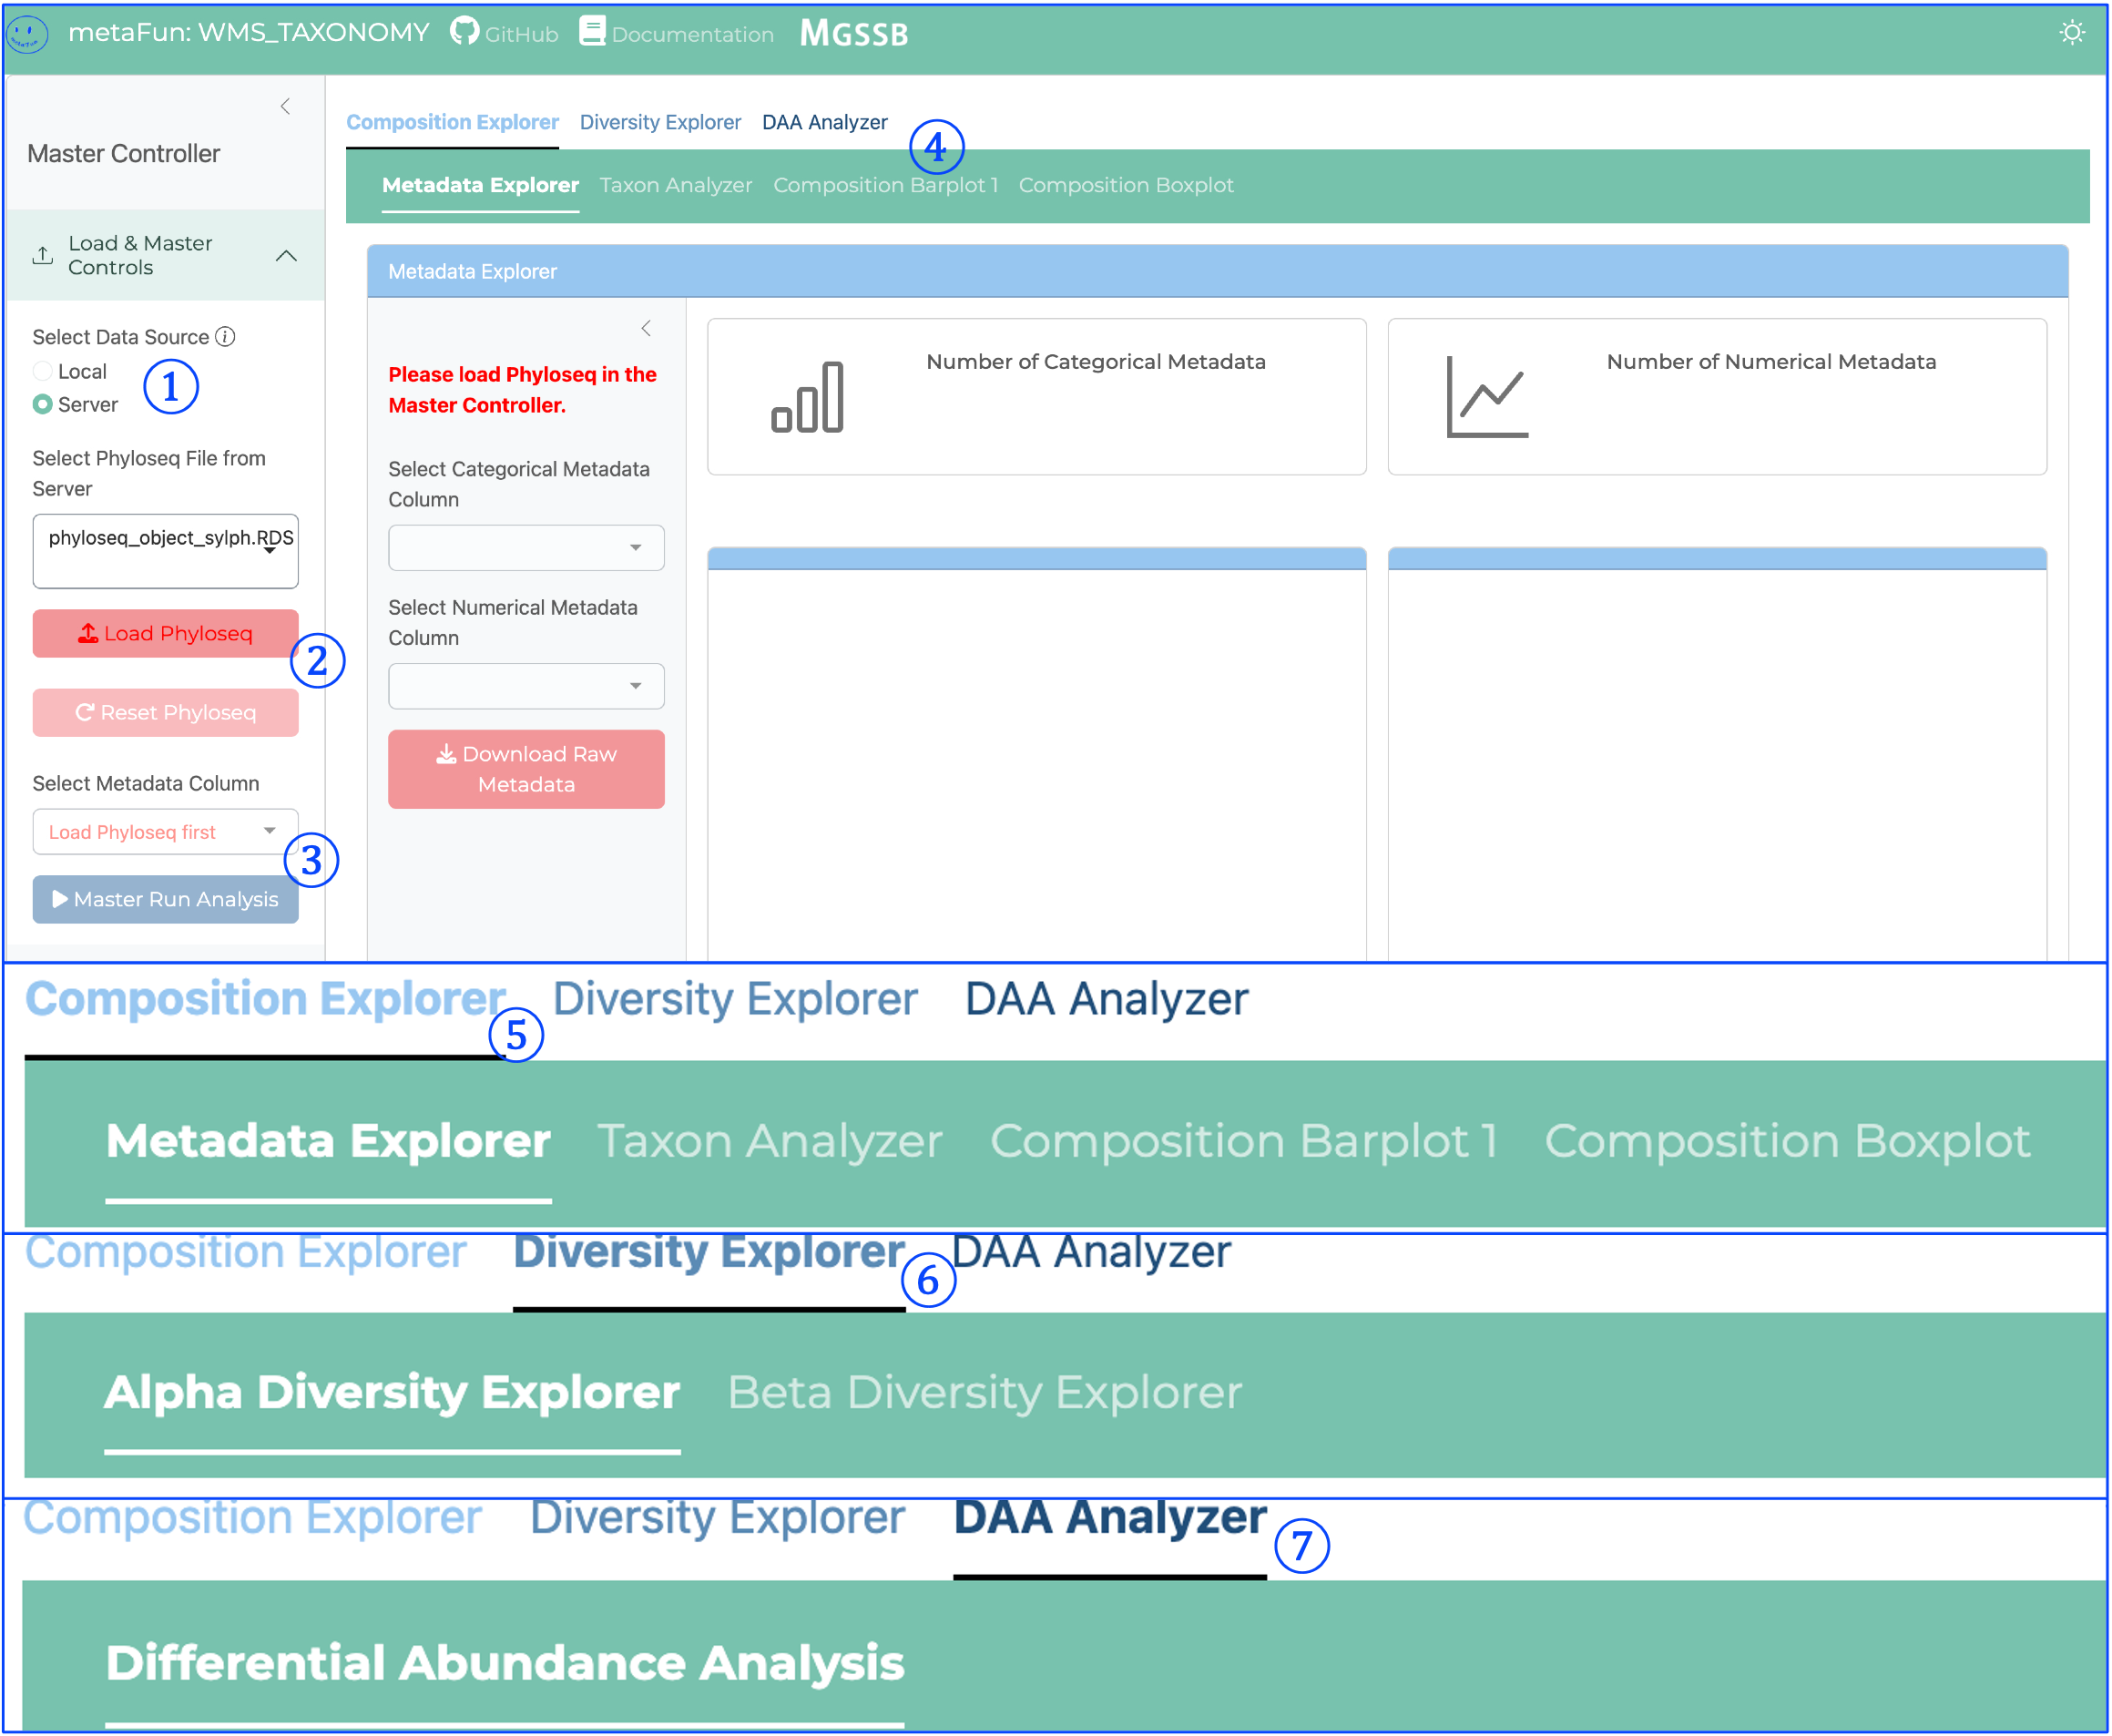
① Data Source Selection:
Toggles between Local and Server data sources
Controls how Phyloseq data is loaded into the application
Essential first step before loading taxonomic data
② Load Phyloseq Button:
Initiates loading of Phyloseq objects created by WMS_TAXONOMY
Reads taxonomic profiles and associated metadata
Required before any analysis can be performed
③ Master Run Analysis Button:
Critical component that processes data for visualization
Initializes data for composition analysis
Must be clicked before viewing Composition Barplot or Boxplot visualizations
Prepares taxonomic data for downstream analyses
④ Composition Explorer Subtabs:
Second-level navigation providing access to different composition analysis tools:
Metadata Explorer: Visualizes sample distribution across metadata categories
Taxon Analyzer: Examines individual taxa distribution
Composition Barplot: Shows relative distribution of taxonomic groups
Composition Boxplot: Displays dominant taxa distribution across groups
⑤ Composition Explorer Main Tab:
First-level navigation tab for taxonomic composition analysis
Contains tools for exploring taxonomic profiles
Allows visualization and comparison of taxonomic distributions
Supports organization of samples by metadata variables
⑥ Diversity Explorer Main Tab:
First-level navigation tab for diversity analysis
Contains subtabs for Alpha and Beta diversity exploration:
Alpha Diversity Explorer: Analyzes within-sample diversity metrics
Beta Diversity Explorer: Examines between-sample diversity relationships
Provides statistical tests and ordination methods
⑦ DAA Analyzer Main Tab:
First-level navigation tab for Differential Abundance Analysis
Contains the Differential Abundance Analysis tool
Identifies statistically significant associations between taxa and metadata
Integrates MaAsLin2 for sophisticated statistical modeling
Generates statistical outputs and visualizations for significant findings
Navigation and Analysis Interface Components#

The interface is organized into a hierarchical structure with main navigation tabs and subtabs for specific analyses. The key components of the interface shown above are:
① Taxonomic Rank Control:
Controls the number of top taxa displayed in visualizations
Slider allows selection of how many taxonomic groups to include
Helps focus on dominant taxa while excluding rare groups
Adjustable from a few taxa to dozens based on analysis needs
Each module allows selecting appropriate taxonomic rank for analysis
② Plot Size Control:
Adjusts the overall dimensions of visualization elements
Controls the size of the plot area for better visual presentation
Particularly useful when preparing figures for different contexts
Ensures proper sizing regardless of screen resolution
③ Plot Components Panel:
Provides access to advanced visualization features
Offers clustering options for grouping similar samples
Controls coordinate systems and axis representations
Enables fine-tuning of visualization elements
④ Text and Axis Settings:
Controls all text elements including titles, labels, and annotations
Adjusts font sizes for optimal readability
Modifies axis titles and appearance
Sets text orientation for axis labels
⑤ Legend Component Controls:
Customizes the appearance of the plot legend
Adjusts legend title and text sizing
Controls legend position (right, left, top, bottom)
Modifies legend formatting for clarity
⑥ Export Settings:
Configures plot size dimensions for downloaded files
Sets width and height in pixels for exported visualizations
Offers multiple file format options (PNG, JPEG, TIFF, PDF)
Ensures publication-quality output for all exported figures
⑦ Alpha Diversity Analysis Panel:
Controls for within-sample diversity analysis
Provides method selection (Shannon, Simpson, etc.)
Allows grouping samples by metadata variables
Includes interactive plot toggles and color palette selection
Provides options for statistical comparison between groups
⑧ Beta Diversity Analysis Panel:
Settings for between-sample diversity comparisons
Offers transformation method selection (Log10)
Provides distance measure options (Bray-Curtis)
Controls taxonomic rank selection for analysis
Allows metadata-based sample grouping
Includes options for ordination methods
⑨ Differential Abundance Analysis Panel:
Settings for statistical testing of taxonomic differences
Requires selection of fixed effects from metadata
Provides options for controlling multiple testing correction
Includes threshold settings for significance filtering
Offers interactive visualization of statistical results
Controls for selecting reference levels for comparisons
These control panels work together to provide a comprehensive environment for both statistical analysis and figure creation, allowing researchers to generate publication-ready visualizations while maintaining analytical rigor.
Parameters#
Parameter |
Description |
Default Value |
Note |
|---|---|---|---|
|
Input directory with WMS_TAXONOMY results |
Required |
Path to WMS_TAXONOMY output containing phyloseq objects |
|
Additional metadata file |
Optional |
CSV file with updated or additional metadata to integrate |
|
Port number for the web interface |
|
Adjust if the default port is already in use |
|
Number of CPU cores to use |
|
For computationally intensive operations |
Inputs and Outputs#
Inputs#
Results directory from a completed WMS_TAXONOMY run, containing Phyloseq objects
Optional additional metadata file in CSV format for enhanced analysis
Outputs#
Exported visualizations in various formats (PNG, PDF, SVG)
Statistical analysis results (CSV, TSV)
Filtered taxonomic tables
Publication-ready figures
Output directory structure#
The generated files are saved in a timestamped output directory:
${launchDir}/results/interactive_taxonomy/YYYYMMDDHHMMSS/
├── exported_figures/                   # Exported visualizations
│   ├── taxonomic_barplot_[timestamp].pdf    # Stacked bar plots
│   ├── taxonomic_boxplot_[timestamp].pdf    # Box plots for specific taxa
│   ├── alpha_diversity_[timestamp].pdf      # Alpha diversity plots
│   ├── beta_diversity_[timestamp].pdf       # Ordination plots
│   └── volcano_plot_[timestamp].pdf         # Differential abundance plots
├── statistical_results/                # Results from statistical tests
│   ├── alpha_diversity_stats_[timestamp].csv  # Alpha diversity statistics
│   ├── beta_diversity_stats_[timestamp].csv   # PERMANOVA results
│   ├── differential_abundance_[timestamp].csv # MaAsLin2 results
│   └── correlation_results_[timestamp].csv    # Correlation analysis
└── exported_data/                      # Exported data tables
    ├── filtered_taxa_[timestamp].csv       # Filtered taxonomic tables
    ├── raw_metadata_[timestamp].csv        # Metadata tables
    └── normalized_counts_[timestamp].csv   # Normalized abundance tables
Interface Components#
The web interface is divided into multiple tabs, each providing specialized tools for different types of taxonomic analysis.
Main Interface Structure#
Tab-specific analysis design
All analyses in this interface are designed to apply only within their respective tabs. Each analytical module operates independently, meaning that:
Settings changed in one tab do not affect the analyses in other tabs
Each tab maintains its own state and configuration
Results generated in one tab are specific to that tab’s analysis
This modular design allows you to run different analyses with different parameters simultaneously without interference
The only exception is the Master Controller Panel, which provides global data loading and the Master Run Analysis button that initializes data for multiple visualization tabs.
Composition Explorer#
This versatile analysis module includes four distinct analytical tools:
Metadata Explorer:
Visualizes the distribution of samples across metadata categories
Provides summary statistics for both categorical and numerical metadata
Helps identify patterns and potential batch effects in your experimental design
Taxon Analyzer:
Examines the distribution of individual taxa across metadata variables
Creates boxplots, scatterplots, or violin plots for selected taxa
Tests for statistical significance in taxon abundance differences between groups
Composition Barplot:
Visualizes the relative distribution of all taxonomic groups across samples
Samples can be ordered by metadata categories
Allows filtering by abundance threshold and taxonomic groups
Shows stacked bars representing the taxonomic composition of each sample
Requires clicking the Master Run Analysis Button before viewing
Composition Boxplot:
For categorical metadata: Shows the distribution of dominant taxa across different categories
For numerical metadata: Visualizes how dominant taxa change along a numerical gradient
Provides statistical tests for significant differences
Requires clicking the Master Run Analysis Button before viewing
Metadata Explorer and Taxon Analyzer#
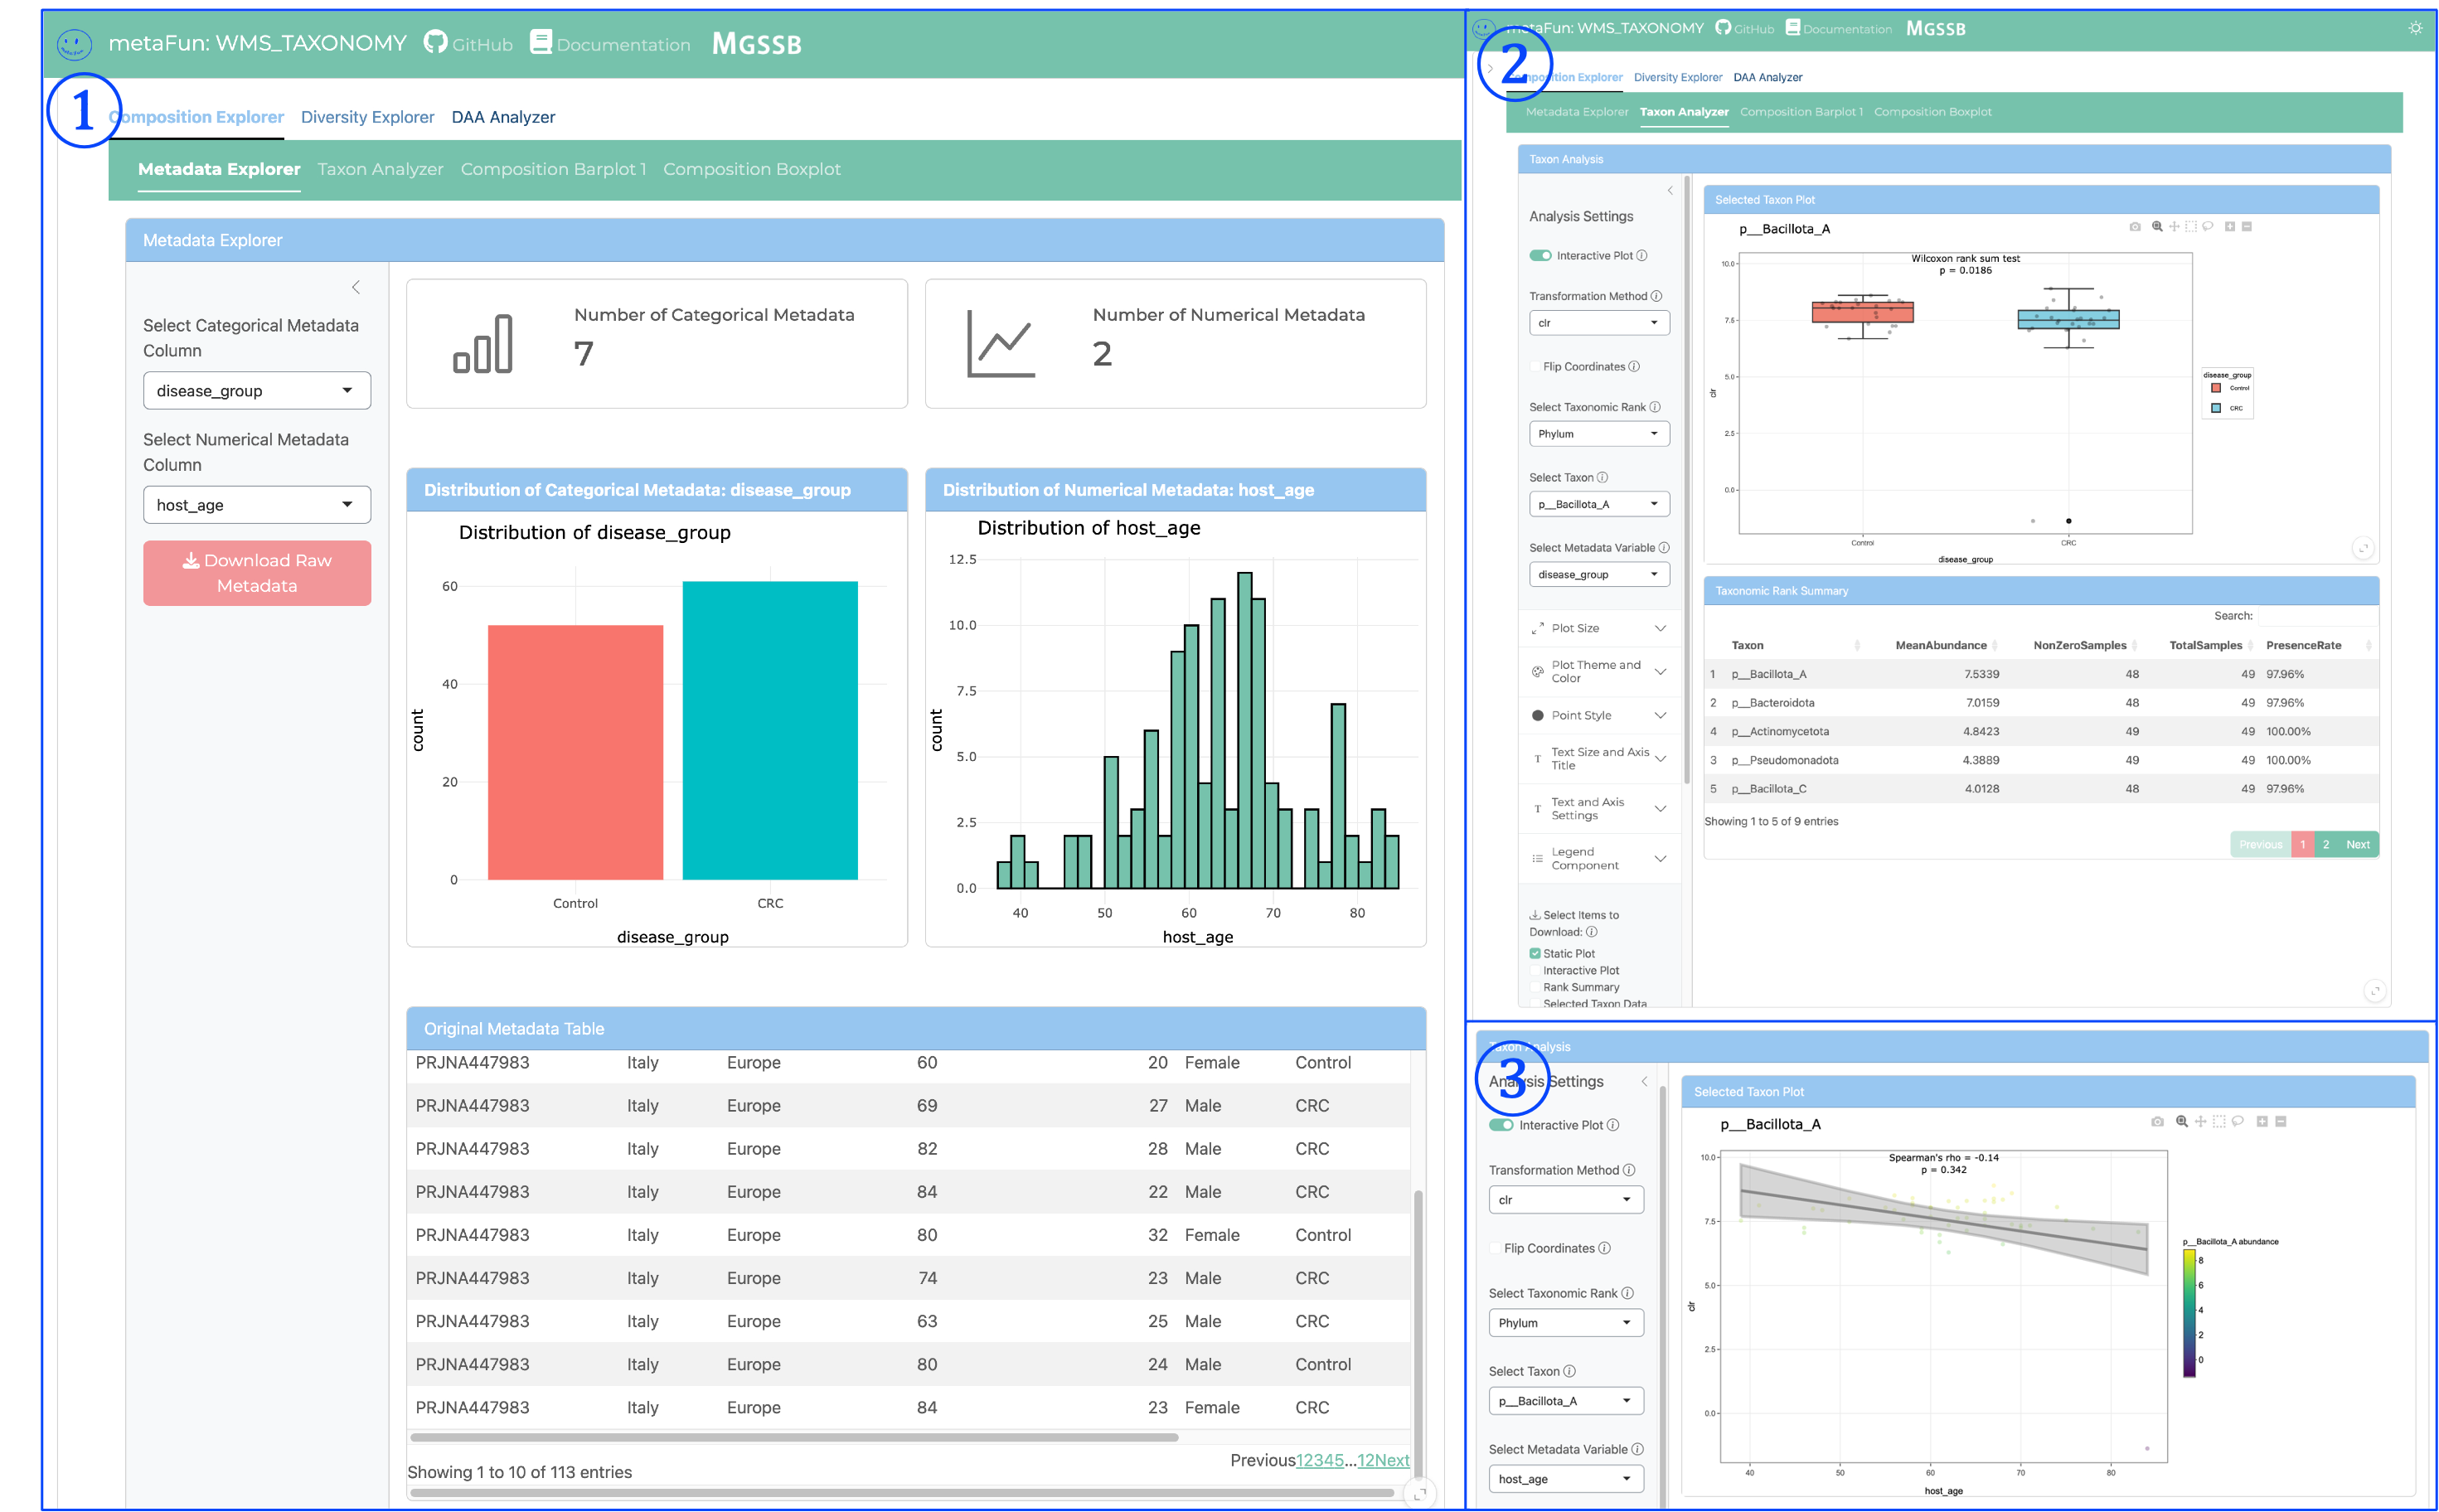
Metadata Explorer provide detailed information of metadata variables and Taxon Analyzer provide detailed examination of individual taxa and their relationships to metadata variables. Key components include:
① Metadata Explorer View:
Presents real-time visualization of metagenomic taxonomy through both graphics and tables
Displays the distribution of categorical metadata (e.g., disease_group) with interactive bar charts
Shows numerical metadata (e.g., host_age) through histogram distributions
Provides a comprehensive metadata table with all sample information
Enables quick assessment of sample distribution across experimental variables
Allows downloading raw metadata for external analysis
② Taxon Analyzer - Categorical Variables:
Visualizes abundance distributions of specific taxa across all taxonomic ranks (Phylum to Species)
Supports various data transformations (raw, log, CLR) for optimal analysis
Allows selection of specific taxonomic ranks for targeted analysis
Provides statistical comparisons between groups using Wilcoxon tests for categorical variables
Displays interactive boxplots with statistical significance indicators
Includes taxonomic summary tables with abundance statistics
Can filter and sort taxa based on abundance or significance
③ Taxon Analyzer - Numerical Variables:
Shows correlation between taxon abundance and numerical metadata variables
Generates interactive scatterplots with regression lines
Calculates and displays statistical measurements including:
Correlation coefficients (Pearson, Spearman)
P-values for significance testing
Confidence intervals
Supports the same taxonomic rank selection and data transformation options
Enables identification of taxa whose abundance correlates with continuous variables
Provides downloadable statistical results for publication
These components work together to provide comprehensive analysis of relationships between specific taxa and experimental variables, allowing researchers to identify biologically relevant patterns in their metagenomic data.
Composition Barplot and Boxplot Visualization#

Note: All Composition analysis tools require clicking the Master Run Analysis Button in the Master Controller panel before they will display results.
① Composition Barplot View:
Displays stacked bar charts representing the relative abundance of all taxa across samples
Each vertical bar represents a single sample’s complete taxonomic profile
Colors indicate different taxonomic groups at the selected rank
Samples are grouped by categorical metadata variables (e.g., disease_group)
Shows the complete community structure in each sample
Can identify patterns in taxonomic composition associated with experimental variables
Allows quick visualization of dominant taxa in different sample groups
② Composition Boxplot - Categorical Variables:
Visualizes the distribution of each taxon’s abundance across categorical metadata variables
Creates boxplots showing median, quartiles, and outliers for each taxon
Enables direct comparison of specific taxa between different categorical groups
Shows statistical distribution information that may not be apparent in the barplot
Identifies taxa with significant differences in abundance between groups
Focuses on the most abundant taxa (configurable using the “Number of Top Taxa to Display” slider)
Provides a more statistical view of taxonomic differences than the barplot
③ Composition Analysis - Numerical Variables:
Creates line plots showing taxon abundance patterns across numerical metadata variables
Each line represents a different taxon’s abundance pattern
X-axis represents the numerical variable (e.g., host_age)
Y-axis shows relative abundance
Reveals trends and correlations between taxonomic abundance and continuous variables
Particularly useful for time series data or age-related studies
Identifies taxa that increase or decrease along a numerical gradient
Supports both taxonomic rank selection and filtering by abundance
Each of these visualization approaches offers complementary insights into taxonomic composition:
Barplots provide a comprehensive view of the entire community structure
Boxplots focus on statistical distributions of individual taxa across categorical variables
Line plots reveal patterns of abundance change across numerical variables
The versatility of these visualization tools allows researchers to explore taxonomic data from multiple perspectives, facilitating comprehensive understanding of microbial community dynamics.
Alpha Diversity Explorer#
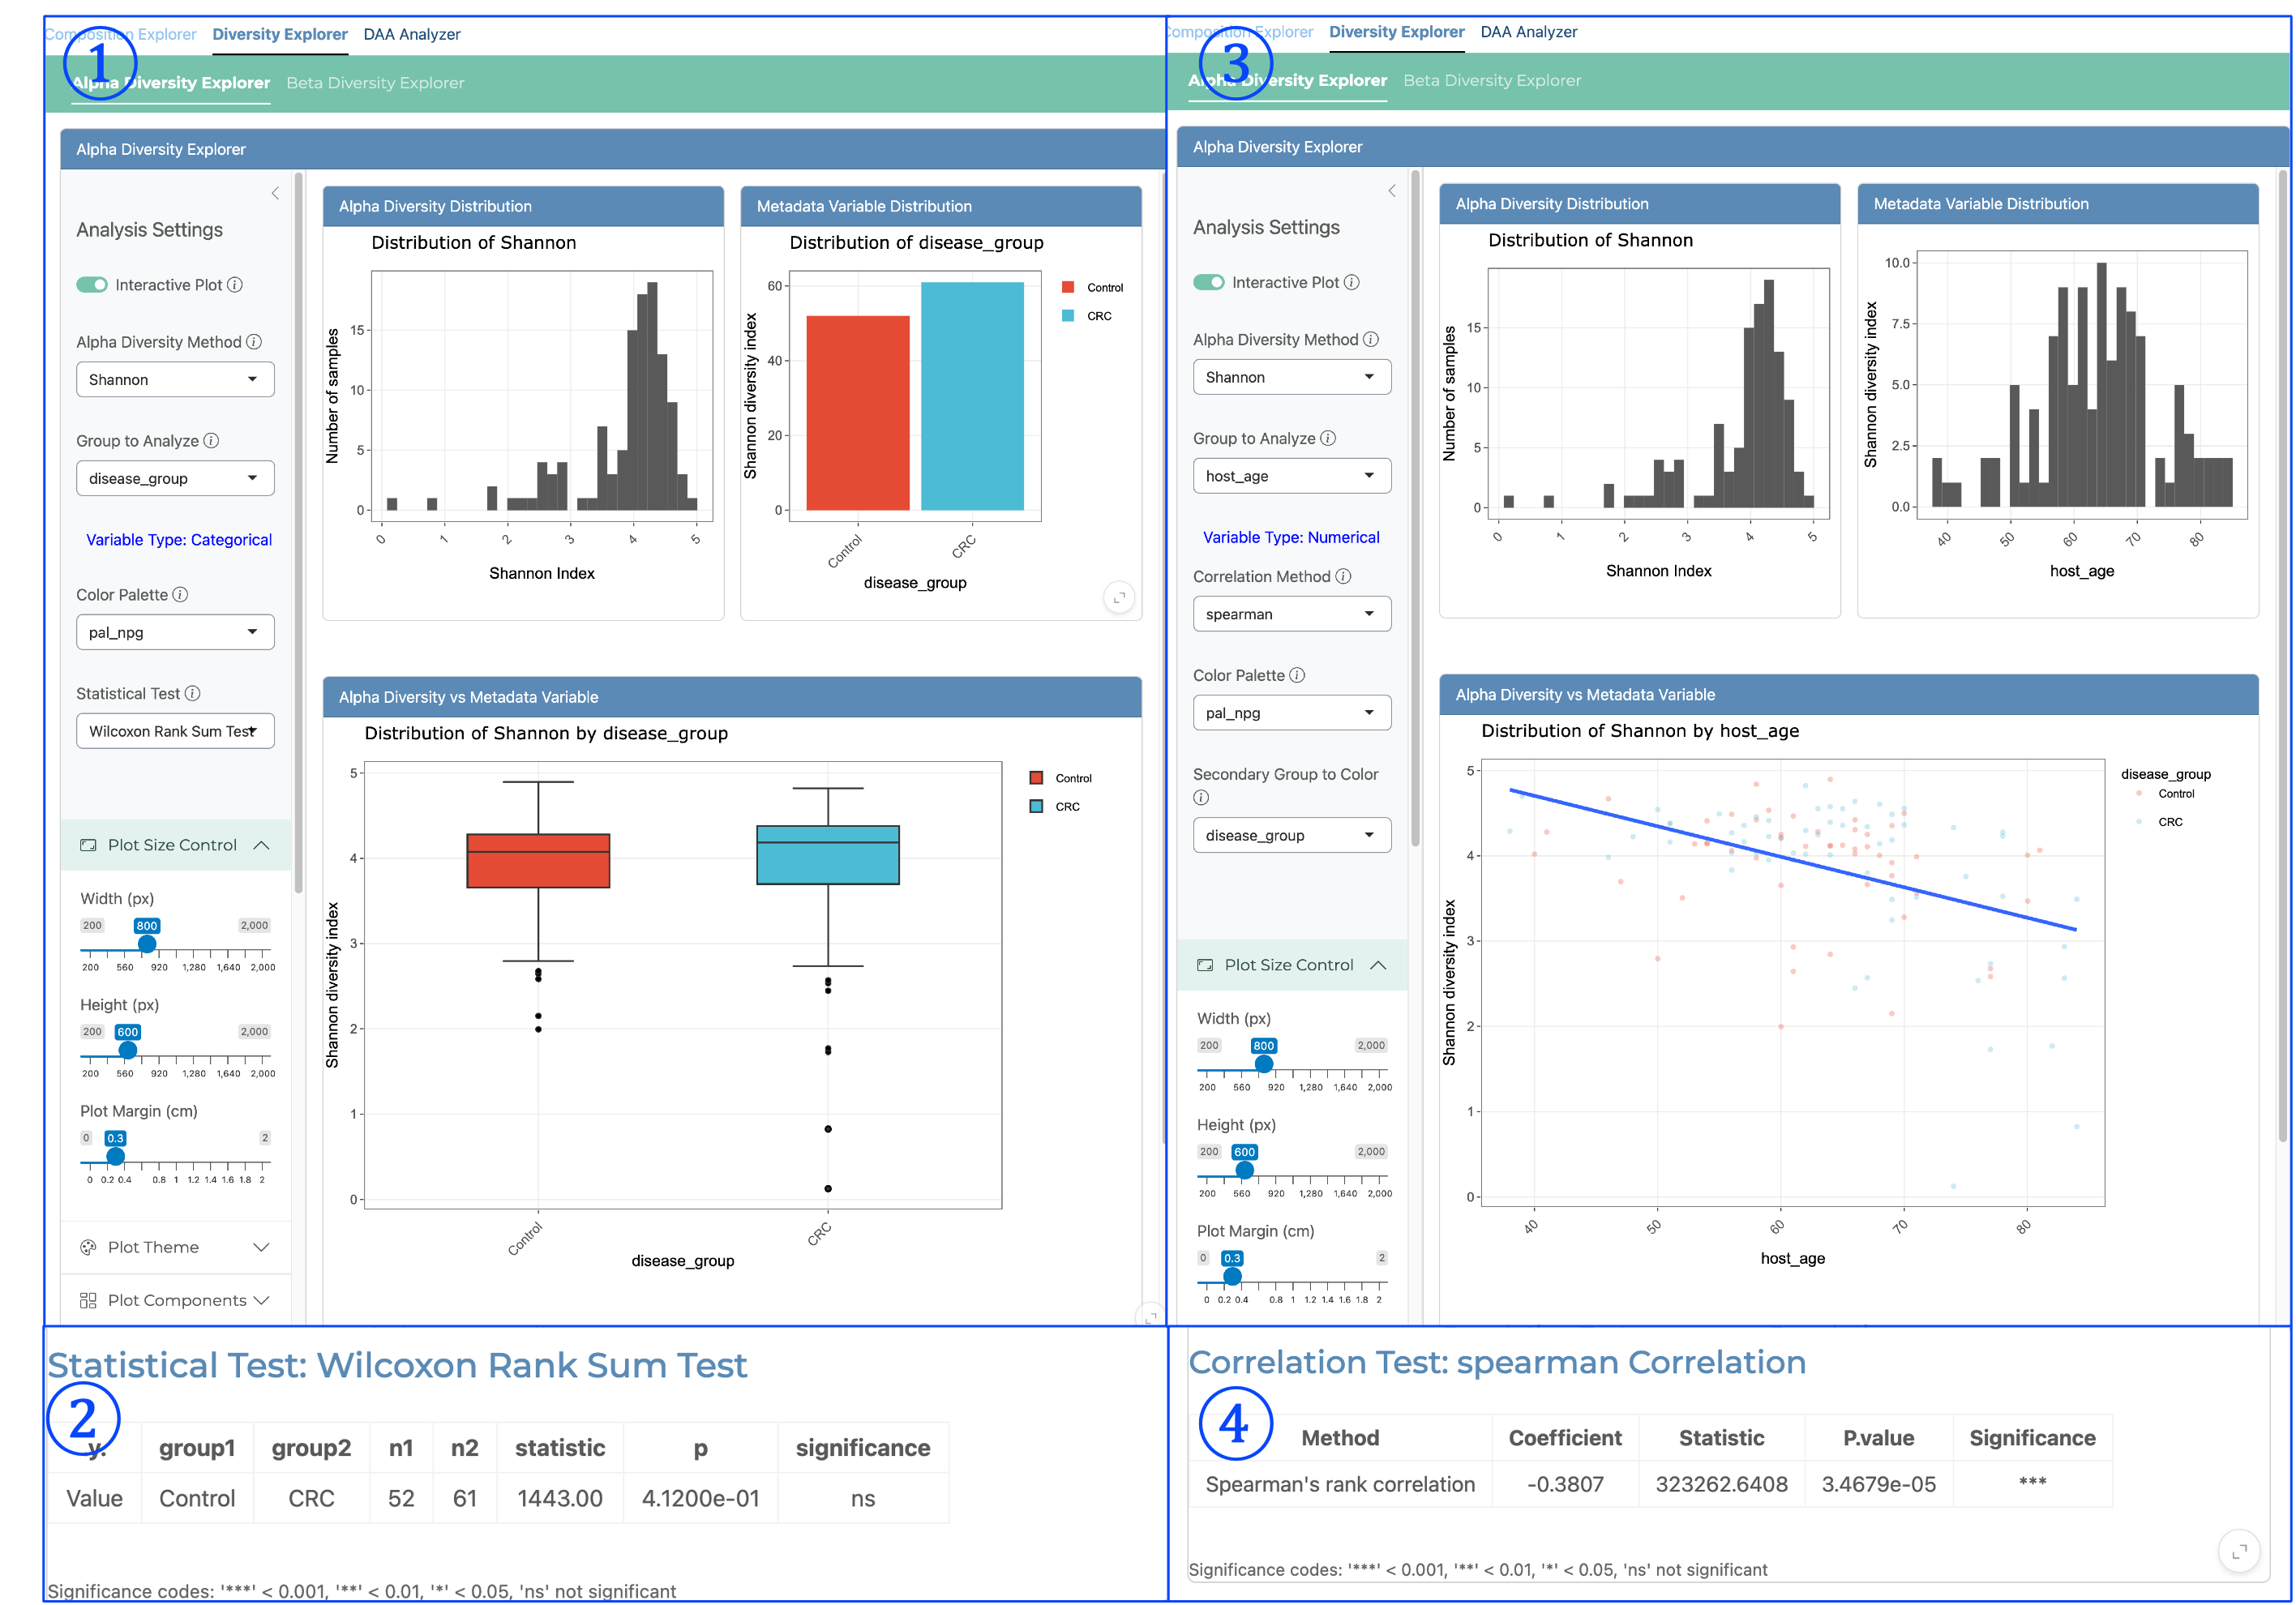
The Alpha Diversity Explorer enables detailed analysis of within-sample diversity metrics and their relationships with metadata variables. Alpha diversity is calculated based on raw relative abundance data and offers multiple diversity indices including Shannon, Simpson, Inverse Simpson, and Pielou’s Evenness. Key components include:
① Alpha Diversity for Categorical Variables - Distribution View:
Displays the distribution of alpha diversity values (e.g., Shannon index) across all samples
Shows the distribution of diversity values within each categorical metadata group
Provides histograms for alpha diversity distribution to assess normality
Enables visual comparison of diversity patterns between different categorical groups
Helps identify differences in microbial community richness and evenness between conditions
② Categorical Statistical Results:
Presents statistical test results comparing alpha diversity between categorical groups
Uses Wilcoxon Rank Sum Test (non-parametric) for two-group comparisons
Displays group names, sample sizes, test statistics, p-values, and significance indicators
Results are presented in a clear tabular format with significance codes
Allows rigorous statistical assessment of diversity differences between experimental groups
Important for determining if diversity changes are statistically significant
③ Alpha Diversity for Numerical Variables - Correlation View:
Shows the relationship between alpha diversity and numerical metadata variables
Provides side-by-side display of alpha diversity distribution and numerical variable distribution
Generates scatterplots of diversity values against the numerical variable
Includes regression line to visualize correlation direction and strength
Can be colored by a secondary categorical variable (e.g., disease_group)
Identifies trends in diversity associated with continuous variables like age or time
④ Numerical Statistical Results:
Presents correlation statistics between alpha diversity and numerical metadata
Uses Spearman’s rank correlation (non-parametric) for robust analysis
Shows correlation coefficient, test statistic, p-value, and significance level
Results are displayed in a clear tabular format with significance codes
Quantifies the strength and direction of relationships between diversity and numerical variables
Essential for determining if diversity patterns correlate significantly with continuous variables
The Alpha Diversity Explorer offers several key features for comprehensive diversity analysis:
Multiple diversity metrics: Shannon (information theory-based), Simpson (dominance-based), Inverse Simpson (diversity-based), and Pielou’s Evenness (community evenness)
Interactive visualization: All plots are interactive, allowing zooming, panning, and highlighting
Statistical rigor: Appropriate statistical tests for both categorical and numerical comparisons
Flexible grouping: Can analyze any metadata variable present in the dataset
Color customization: Palette selection for visual clarity and consistency
Alpha diversity analysis provides insights into the complexity and richness of microbial communities, helping researchers understand how community structure varies across metadata variables.
Beta Diversity Explorer#

The Beta Diversity Explorer enables comprehensive analysis of between-sample diversity, revealing how microbiome compositions differ across samples and identifying factors that drive community differences. Key components include:
① Categorical Ordination Analysis:
Displays Principal Coordinates Analysis (PCoA) plot showing sample relationships in reduced dimensionality
Each point represents a sample, with distances between points reflecting community dissimilarity
Colors are mapped to categorical metadata variables (e.g., disease_group: Control vs. CRC)
Visualizes clustering patterns associated with categorical variables
Includes PERMANOVA statistical results below the plot to quantify the significance of group separation
Shows variance explained by each principal coordinate axis (e.g., “PCo1 [19.7%]”)
Essential for visualizing how categorical variables (disease, treatment, location) influence community structure
② Intra-group Distance Analysis:
Shows boxplots of within-group beta diversity distances (e.g., Bray-Curtis dissimilarity)
Compares the internal consistency of microbial communities within each categorical group
Lower values indicate more similar communities within a group
Includes outlier identification for unusual samples
Provides Pairwise Wilcoxon Test Results to statistically evaluate group differences
Displays median distances and statistical significance between groups
Useful for determining if certain conditions lead to more variable or consistent microbiomes
③ Numerical Variable Ordination Analysis:
PCoA plot with sample points colored by a continuous numerical variable (e.g., host_age)
Color gradient reveals how community structure changes across the numerical spectrum
Enables visualization of gradual community shifts associated with continuous variables
Includes PERMANOVA results quantifying the significance of the numerical variable’s effect
Shows R-squared values indicating proportion of community variation explained by the variable
Especially valuable for time series, environmental gradients, or patient characteristics
Reveals patterns that might be missed when using only categorical groupings
④ Distance-Decay Relationship Analysis:
Scatterplot showing correlation between pairwise differences in numerical metadata and corresponding beta diversity distances
X-axis represents pairwise differences in the numerical variable (e.g., host_age differences between samples)
Y-axis shows corresponding Bray-Curtis dissimilarity between those same sample pairs
Regression line with confidence interval reveals the relationship strength and direction
Linear Regression Results table provides detailed statistical output:
Slope, intercept, and R-squared values
P-values for significance testing
Analysis for different subgroups (All data, Different Groups, specific conditions)
Quantifies whether samples with more similar numerical characteristics have more similar microbiomes
Tests the ecological principle that community similarity decays with increasing environmental difference
The Beta Diversity Explorer offers several powerful features:
Multiple distance metrics: Supports various ecological distance measures including Bray-Curtis (abundance-weighted), Jaccard (presence/absence), and Aitchison (compositional)
Data transformation options: Log, CLR, or raw abundance transformations for optimal analysis
Taxonomic rank flexibility: Analyze at any level from Phylum to Species
Statistical rigor: PERMANOVA for significance testing of metadata variables
Interactive visualization: Ordination plots with zoom, hover information, and selection tools
Multiple ordination methods: PCoA and PCA dimensionality reduction techniques
Beta diversity analysis is crucial for understanding the factors that shape microbiome composition and identifying significant associations between metadata variables and community structure.
Differential Abundance Analysis#

The Differential Abundance Analysis (DAA) module provides sophisticated statistical testing to identify taxa that significantly differ between experimental conditions or correlate with continuous variables. This module integrates MaAsLin2 (Microbiome Multivariable Association with Linear Models), a comprehensive statistical framework specifically designed for microbiome data analysis.
① Interactive Association Plot (Volcano Plot):
Visualizes the global pattern of differential abundance across all taxa
X-axis represents effect size (coefficient) showing direction and magnitude of association
Y-axis shows statistical significance (-log10 p-value)
Each point represents a taxon, with colors indicating significance and metadata group
Interactive features allow selecting points or hovering for detailed information
Adjustable significance threshold with FDR (False Discovery Rate) slider
Key features include:
Multiple testing correction options (BH, Bonferroni)
Adjustable Q-value threshold for controlling false discovery rate
Output directory specification for saving results
Color palette customization for visualization clarity
Supports analysis across all taxonomic ranks (Phylum to Species)
Offers multiple data transformation options:
Center log-ratio (CLR) transformation - addresses compositional nature of microbiome data
Log transformation - reduces effect of extreme values
Relative abundance (raw data) - maintains original scale
Allows flexible model building:
Selection of fixed effects (experimental variables of interest)
Inclusion of random effects (batch effects, repeated measures)
Control for confounding variables in complex experimental designs
② Results Table View:
Comprehensive tabular presentation of linear regression results for all taxa
Displays detailed statistical outputs for each species-metadata association:
Feature (taxon name)
Metadata variable tested
Value (metadata category being compared)
Reference level for comparison
Coefficient (effect size and direction)
Standard error of the estimate
P-value for statistical significance
Q-value (FDR-corrected p-value)
Sample size (N) included in the analysis
Sortable columns for identifying strongest associations
Searchable interface for finding specific taxa
Paginated view with adjustable entries per page
Download options for complete result tables
Shows all tested taxa regardless of significance level
Provides comprehensive statistical evidence for publication
③ Focused Metadata Analysis:
Interactive exploration of associations for specific metadata variables
Dropdown menu for selecting the metadata variable of interest
Focused volcano plot showing only associations with the selected variable
Ability to select specific points to view detailed information
Selected points displayed in a detailed results table below
Highlights strongest associations for the selected metadata variable
Enables identification of taxa consistently associated with specific conditions
Provides context-specific visualization for targeted analysis
Data points can be selected for detailed investigation:
Taxa names with full taxonomic lineage
Precise coefficient values and confidence intervals
Exact p-values and q-values for statistical rigor
Effect sizes contextualized by metadata variable
The MaAsLin2 statistical framework employed by this module offers several advantages:
Robust statistical modeling: Uses linear models that can incorporate multiple covariates, allowing researchers to control for confounding factors. Recent comprehensive benchmarking by Wirbel et al. (2024) found that linear models outperform many specialized methods in controlling false discovery rates while maintaining high sensitivity in microbiome differential abundance testing.
Compositional data handling: Addresses the compositional nature of microbiome data through appropriate transformations
Multiple comparison correction: Controls false discovery rate in the context of many simultaneous tests
Flexible model specification: Allows for both categorical and continuous metadata variables
Batch effect control: Can incorporate random effects to account for technical variation
The DAA Analyzer supports comprehensive statistical analysis of differential abundance, enabling researchers to:
Identify biomarkers associated with disease states, treatments, or environmental conditions
Quantify the strength and direction of associations between taxa and metadata
Control for confounding variables in complex experimental designs
Generate publication-quality visualizations and statistical tables
Perform hypothesis testing with appropriate statistical rigor
Export comprehensive results for downstream analysis and reporting
This module provides a statistically rigorous framework for identifying microbial signatures associated with experimental conditions, offering insights into which specific taxa may play functional roles in different contexts.
Usage Workflow#
A typical analysis workflow in the INTERACTIVE_TAXONOMY module includes:
Load your Phyloseq data using the Master Controller Panel
Click the Master Run Analysis Button to process data for composition analysis
Use Composition Explorer to get an overview of your taxonomic profiles
Explore community diversity patterns using Alpha and Beta Diversity Explorers
Identify statistically significant associations with the Differential Abundance Analysis
Export results as publication-ready figures and data tables
Tips for optimal performance
For large datasets, focus your analysis by filtering to specific taxonomic groups of interest
Use appropriate data transformations for compositional data (CLR for Differential Abundance Analysis)
Consider the biological relevance of results alongside statistical significance
Export both visualizations and raw statistical outputs for comprehensive documentation
Loading phyloseq objects from non-standard locations
If your phyloseq objects are stored in a location other than the standard WMS_TAXONOMY output directory, you can:
Navigate to the Master Controller Panel
Use the file selection option to point to your specific .RDS files
The application will automatically validate and load compatible phyloseq objects
This feature is particularly useful when working with phyloseq objects created outside the metaFun pipeline
Usage Notes#
The INTERACTIVE_TAXONOMY module works with both Kraken2/Bracken and Sylph results from the WMS_TAXONOMY module.
For optimal performance with large datasets (>100 samples), consider increasing the CPU allocation.
The interface automatically detects available metadata variables, allowing flexible analysis.
Keep the terminal running while using the web interface; closing it will terminate the server.
If you initially ran WMS_TAXONOMY without specifying an analysis column (
--analysiscolumn 0or not specified), you can still perform all statistical analyses in this interactive module.Additional metadata can be provided through the
-mparameter to enhance your analysis or update existing metadata.Important abundance estimation differences: Sylph and Kraken2/Bracken use fundamentally different approaches to estimate microbial abundance:
Sylph estimates taxonomic abundance based on whole-genome matching to reference sequences (doi: 10.1038/s41592-021-01141-3)
Kraken2 with Bracken estimates sequence abundance (read counts) by assigning individual reads to taxa and adjusting for database biases
These differences should be considered when interpreting results, especially for quantitative analyses across studies using different profilers
Example Workflows#
Comparing Taxonomic Profiles Across Treatment Groups#
Load WMS_TAXONOMY results containing samples from different treatment groups
Use the Composition Barplot to visualize profiles at the genus level
Group samples by treatment and compare compositions visually
Perform alpha diversity analysis to assess richness differences
Run PERMANOVA tests in the Beta Diversity Explorer to quantify group differences
Identify differentially abundant taxa between treatment groups using MaAsLin2
Export visualizations and statistical results for publication
Exploring Correlations Between Taxonomy and Clinical Variables#
Load WMS_TAXONOMY results with patient metadata
Analyze alpha diversity metrics in relation to clinical variables
Perform ordination analysis colored by different clinical parameters
Use the Taxon Analyzer to identify specific taxa associated with clinical measurements
Generate box plots showing abundance patterns across clinical categories
Export significant correlations for follow-up investigation
Time Series Analysis of Microbiome Development#
Load WMS_TAXONOMY results from longitudinal sampling
Visualize taxonomic shifts over time using the Composition Barplot
Track alpha diversity changes across time points
Perform beta diversity analysis to measure community drift
Use MaAsLin2 to identify taxa that significantly increase or decrease over time
Export time series visualizations for publication
Technical Implementation#
The INTERACTIVE_TAXONOMY module is built using the Shiny framework and implements a modular architecture:
Core Components:
app.R: Main application file defining the UI structure and server logic
helper/plot_customization.R: Shared functions for plot styling and customization
Analytical Modules:
compositionBarPlot.R: Stacked bar plots for taxonomic composition
plotBox_composition.R: Box plots for taxon distribution across groups
metadataExplorer.R: Metadata visualization and exploration tools
taxonAnalyzer_2025_Feb.R: Individual taxon abundance analysis
alphaDiversityExplorer.R: Alpha diversity metrics and statistics
betaDiversityExplorer.R: Ordination and distance-based analysis
DAA_maaslin2.R: Differential abundance analysis using MaAsLin2
Each module is designed as a self-contained component with its own UI and server logic, allowing for independent development and maintenance while ensuring consistent data handling across the application.
Next Steps#
After exploring taxonomic data in the INTERACTIVE_TAXONOMY module, you can:
Proceed to functional analysis with the WMS_FUNCTION module to understand the metabolic potential
Integrate taxonomic insights with genomic data from the COMPARATIVE_ANNOTATION module
Export processed data for custom analyses in R or Python
Generate publication-quality figures directly from the interface
The INTERACTIVE_TAXONOMY module provides a comprehensive taxonomic analysis, enabling researchers to derive biological insights from complex metagenomic data without extensive bioinformatics expertise.