INTERACTIVE_STRAIN#
 This module is a part of metaFun pipeline, providing an interactive web interface for exploring and analyzing strain-level diversity results generated by InStrain.
Overview#
The INTERACTIVE_STRAIN module offers a dynamic, web-based platform for visualizing and analyzing strain-level metagenomic data. It allows researchers to interactively explore nucleotide diversity patterns, analyze selection pressure through pN/pS ratios, identify shared strains across samples, and correlate diversity metrics with metadata variables. The module leverages preprocessed InStrain output, enabling advanced statistical analyses and customizable visualizations without requiring programming knowledge.
This module provides an interactive alternative to command-line analysis, allowing users to explore different metrics and comparisons dynamically rather than specifying them in advance.
Module Execution#
# Basic usage with WMS_STRAIN results
(metafun) metafun -module INTERACTIVE_STRAIN -i results/metagenome/WMS_STRAIN

# Specify custom port for the web interface
(metafun) metafun -module INTERACTIVE_STRAIN -i results/metagenome/WMS_STRAIN -p 8080

# Add additional metadata file
(metafun) metafun -module INTERACTIVE_STRAIN -i results/metagenome/WMS_STRAIN -m updated_metadata.csv
Module Operation Sequence#
This module performs the following steps:
Loading strain-level data from WMS_STRAIN results:
Reading InStrain profile outputs from all samples
Integrating nucleotide diversity and pN/pS data
Loading GTDB taxonomic metadata for genome annotation
Combining with sample metadata
Launching an interactive web server with multiple analytical modules:
Shared Taxa Analysis for strain distribution visualization
Nucleotide Diversity Explorer for microdiversity analysis
pN/pS Analysis for selection pressure investigation
Diversity-pN/pS Correlation for integrated analysis
Enabling on-demand analysis through interactive components:
Dynamic filtering by genome, sample, or metadata
Statistical testing across conditions
Customizable visualization options
Data export for downstream applications
Parameters#
Parameter |
Description |
Default Value |
Note |
|---|---|---|---|
|
Input directory with WMS_STRAIN results |
Required |
Path to WMS_STRAIN output containing InStrain profiles |
|
Additional metadata file |
Optional |
CSV/TSV file with updated or additional sample metadata |
|
GTDB metadata file |
Auto-detected |
TSV file with genome taxonomic information |
|
Port number for the web interface |
|
Adjust if the default port is already in use |
|
Number of CPU cores to use |
|
For computationally intensive operations |
Inputs and Outputs#
Inputs#
Results directory from a completed WMS_STRAIN run, containing InStrain profile outputs
Optional additional metadata file in CSV/TSV format for enhanced analysis
Optional GTDB metadata file for taxonomic annotation
Outputs#
Exported visualizations in various formats (PNG, PDF, SVG)
Statistical analysis results (CSV, TSV)
Filtered data tables
Publication-ready figures
Output directory structure#
The generated files are saved in a timestamped output directory:
${launchDir}/results/interactive_strain/YYYYMMDDHHMMSS/
├── exported_figures/                     # Exported visualizations
│   ├── shared_taxa_venn_[timestamp].pdf       # Venn diagrams
│   ├── shared_taxa_upset_[timestamp].pdf      # UpSet plots
│   ├── nucleotide_diversity_[timestamp].pdf   # Diversity boxplots/heatmaps
│   ├── pnps_analysis_[timestamp].pdf          # pN/pS distribution plots
│   └── correlation_plot_[timestamp].pdf       # Diversity vs pN/pS correlations
├── statistical_results/                  # Results from statistical tests
│   ├── diversity_stats_[timestamp].csv        # Diversity statistics
│   ├── pnps_comparison_[timestamp].csv        # pN/pS comparison results
│   └── correlation_results_[timestamp].csv    # Correlation analysis
└── exported_data/                        # Exported data tables
    ├── shared_taxa_matrix_[timestamp].csv     # Taxa sharing matrix
    ├── diversity_data_[timestamp].csv         # Nucleotide diversity values
    └── pnps_data_[timestamp].csv              # pN/pS ratio data
Interface Components#
The web interface is divided into multiple tabs, each providing specialized tools for different types of strain-level analysis.
Main Interface Structure#
The main interface consists of a sidebar panel for parameter configuration, navigation tabs for accessing different analysis modules (Shared Taxa Analysis, Nucleotide Diversity, pN/pS Analysis, Diversity vs pN/pS), and a main content area displaying analysis results.
Sidebar Panel#
The sidebar panel provides controls for loading WMS_STRAIN results. Users specify the InStrain output directory path, and the application automatically loads all profile data including sample metadata from the integrated_microbiome_data.rds file. Optional inputs include GTDB metadata file for taxonomic annotation and additional sample metadata file if needed.
Understanding popANI and conANI
InStrain calculates two ANI metrics for strain comparison:
popANI (population-level ANI): Considers both major and minor alleles, accounting for within-sample microdiversity
conANI (consensus ANI): Compares only consensus (major) alleles between samples
The default threshold of 99.999% popANI is recommended for identifying shared strains. Users can adjust these thresholds in the Shared Taxa Analysis module based on their research needs. For more details, see the InStrain documentation.
Tab-specific analysis design
All analyses in this interface are designed to apply only within their respective tabs. Each analytical module operates independently, meaning that:
Settings changed in one tab do not affect the analyses in other tabs
Each tab maintains its own state and configuration
Results generated in one tab are specific to that tab’s analysis
This modular design allows you to run different analyses with different parameters simultaneously without interference
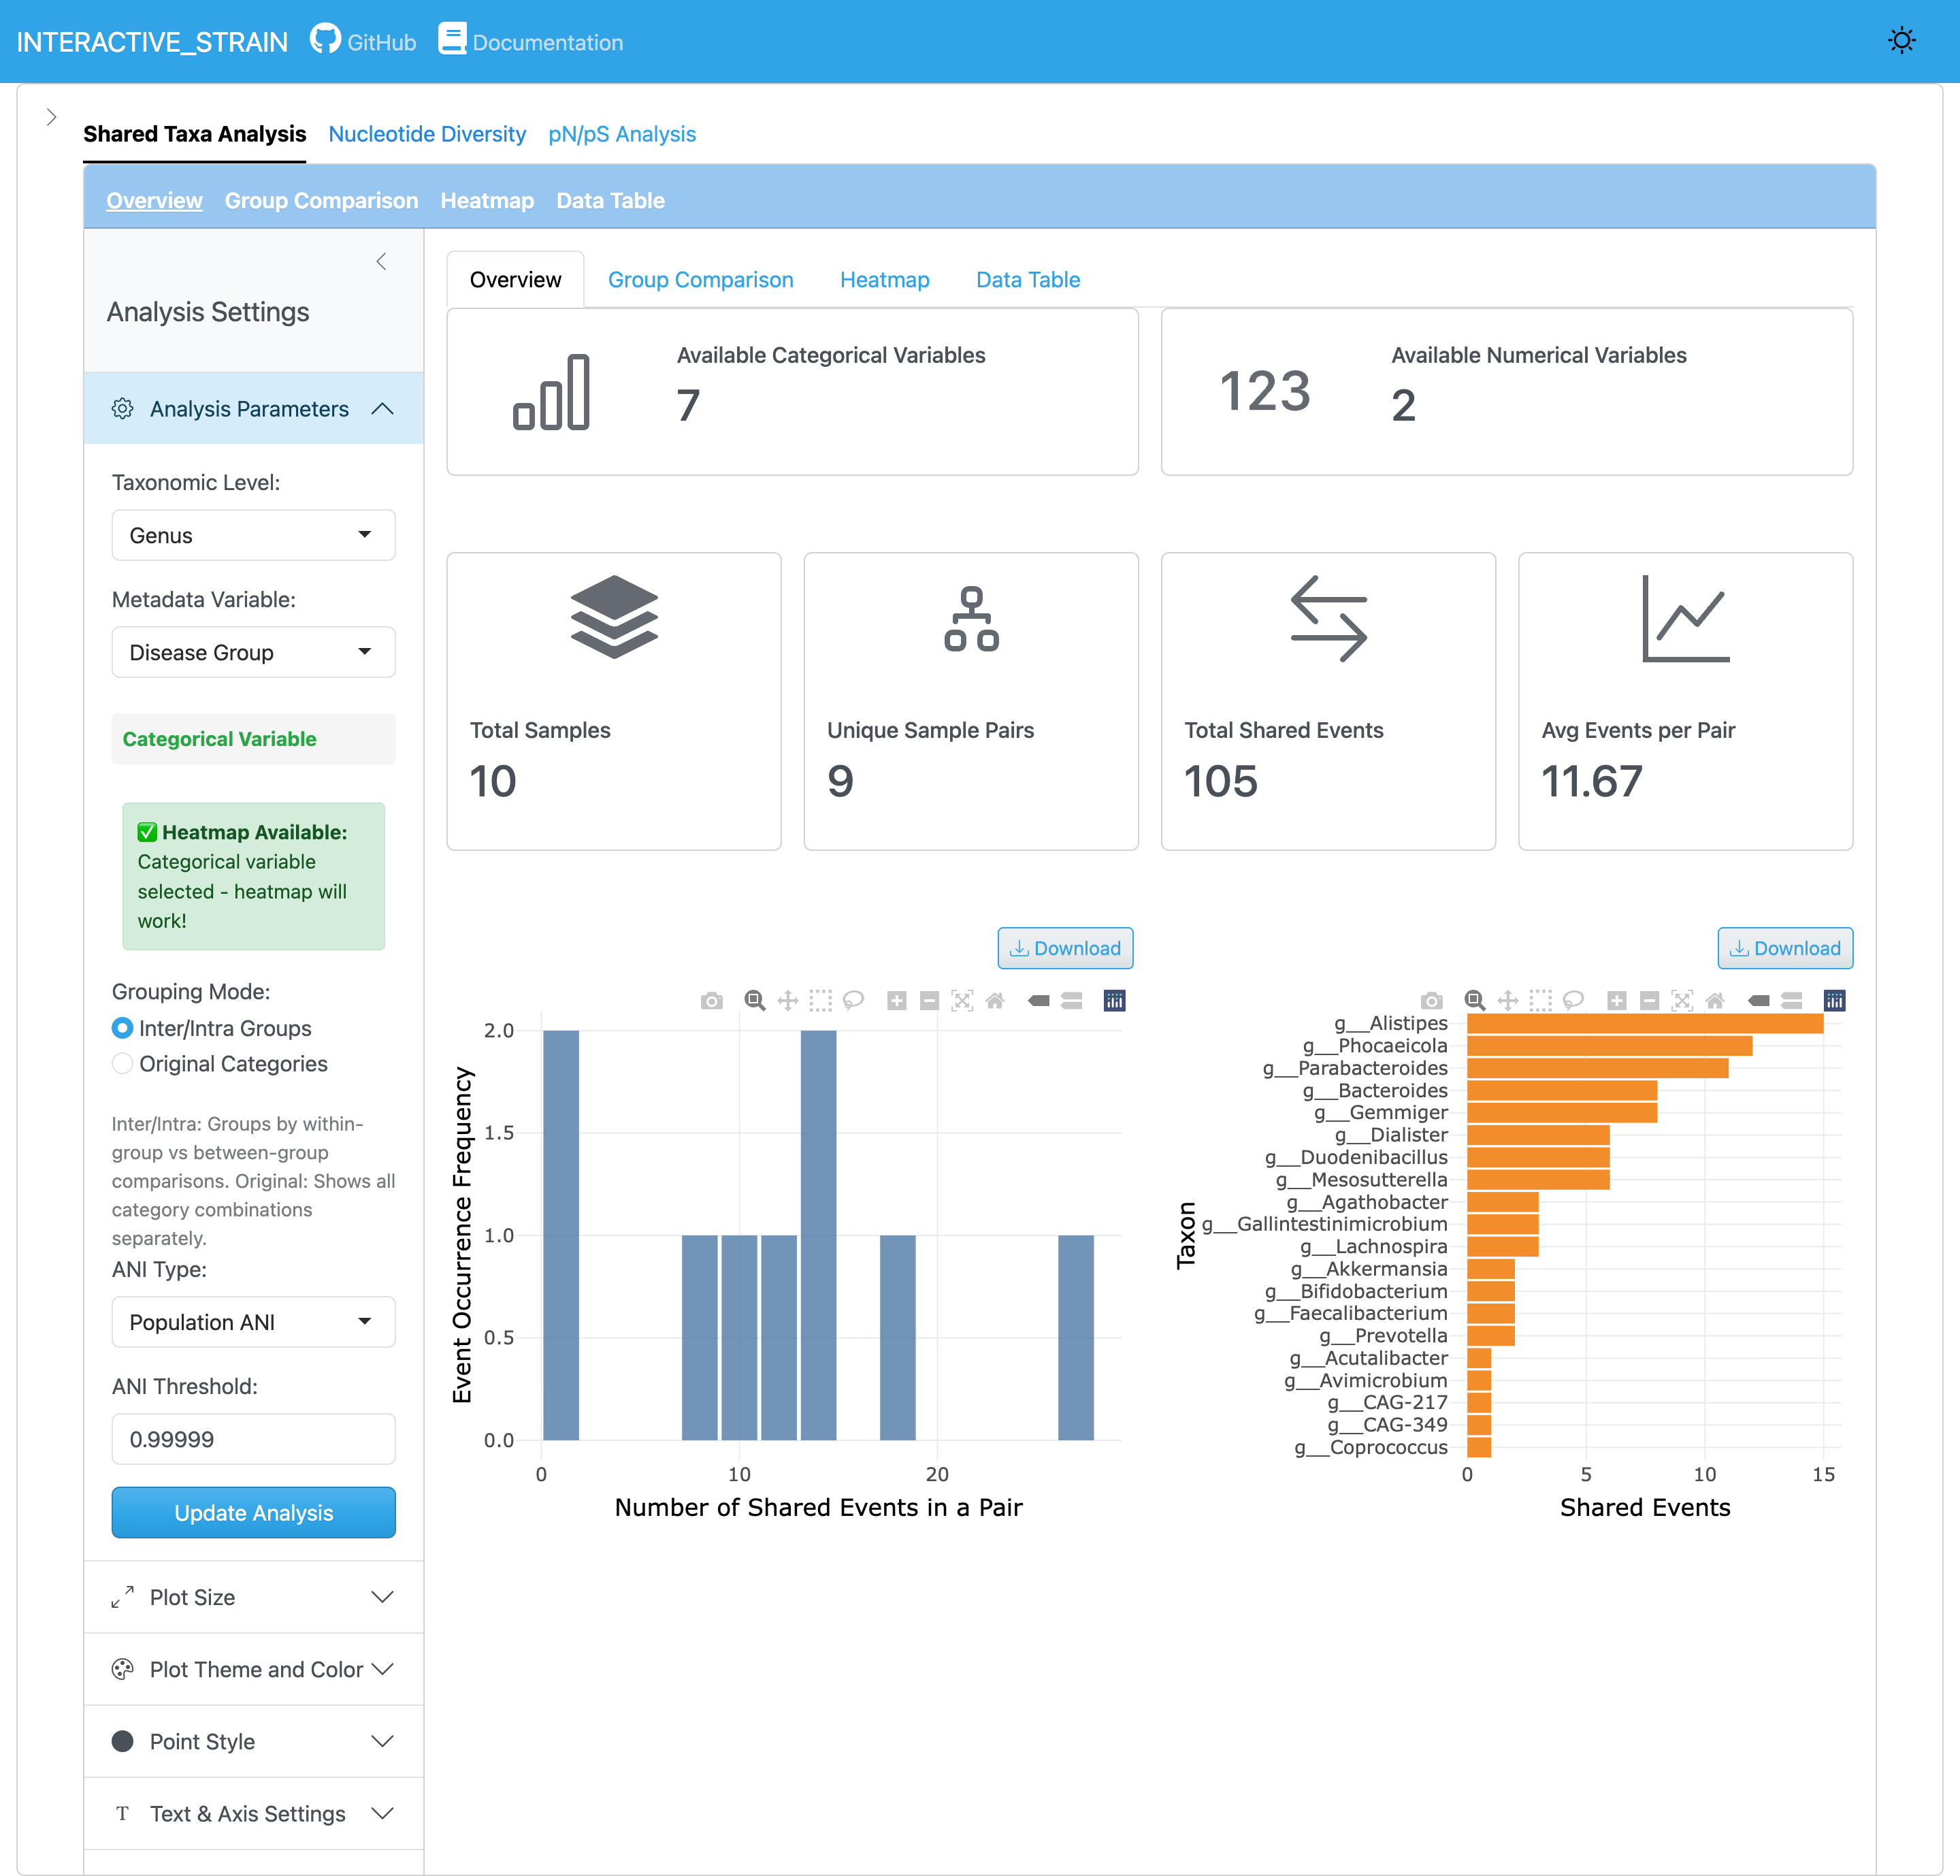
Shared Taxa Analysis#
This module identifies and visualizes strains/genomes shared across samples.
The shared taxa count view displays Venn diagrams and UpSet plots showing overlapping taxa between sample groups. It visualizes the number of shared and unique genomes across conditions, with intersection sizes for all combinations of groups.
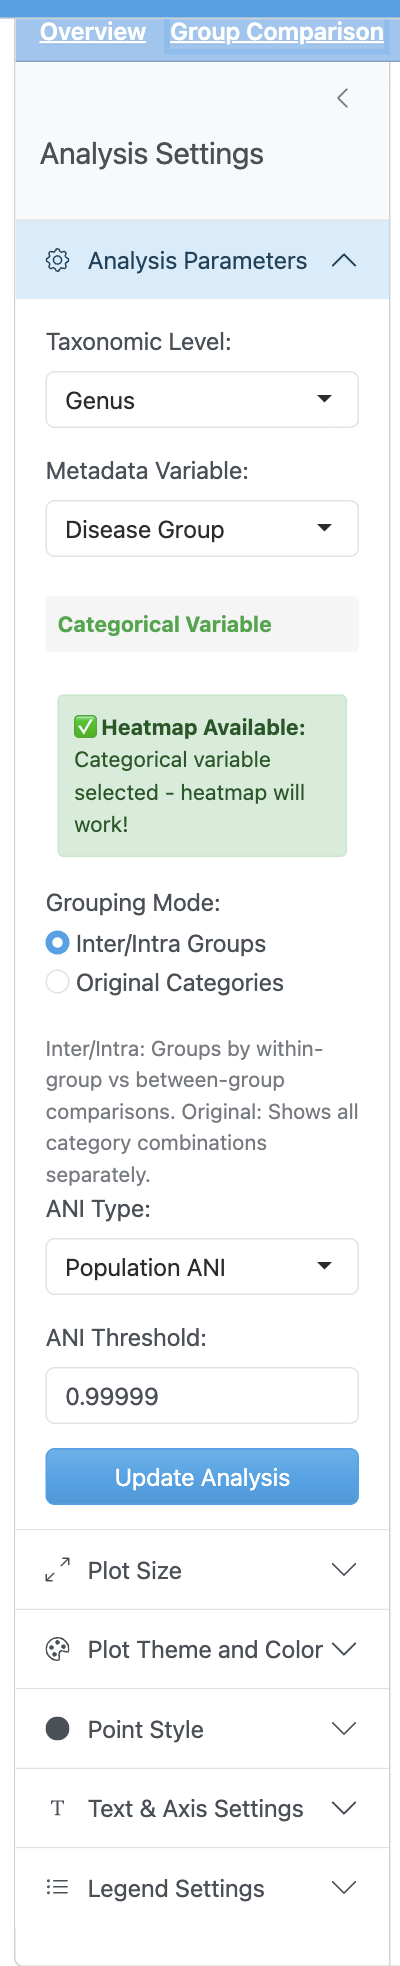
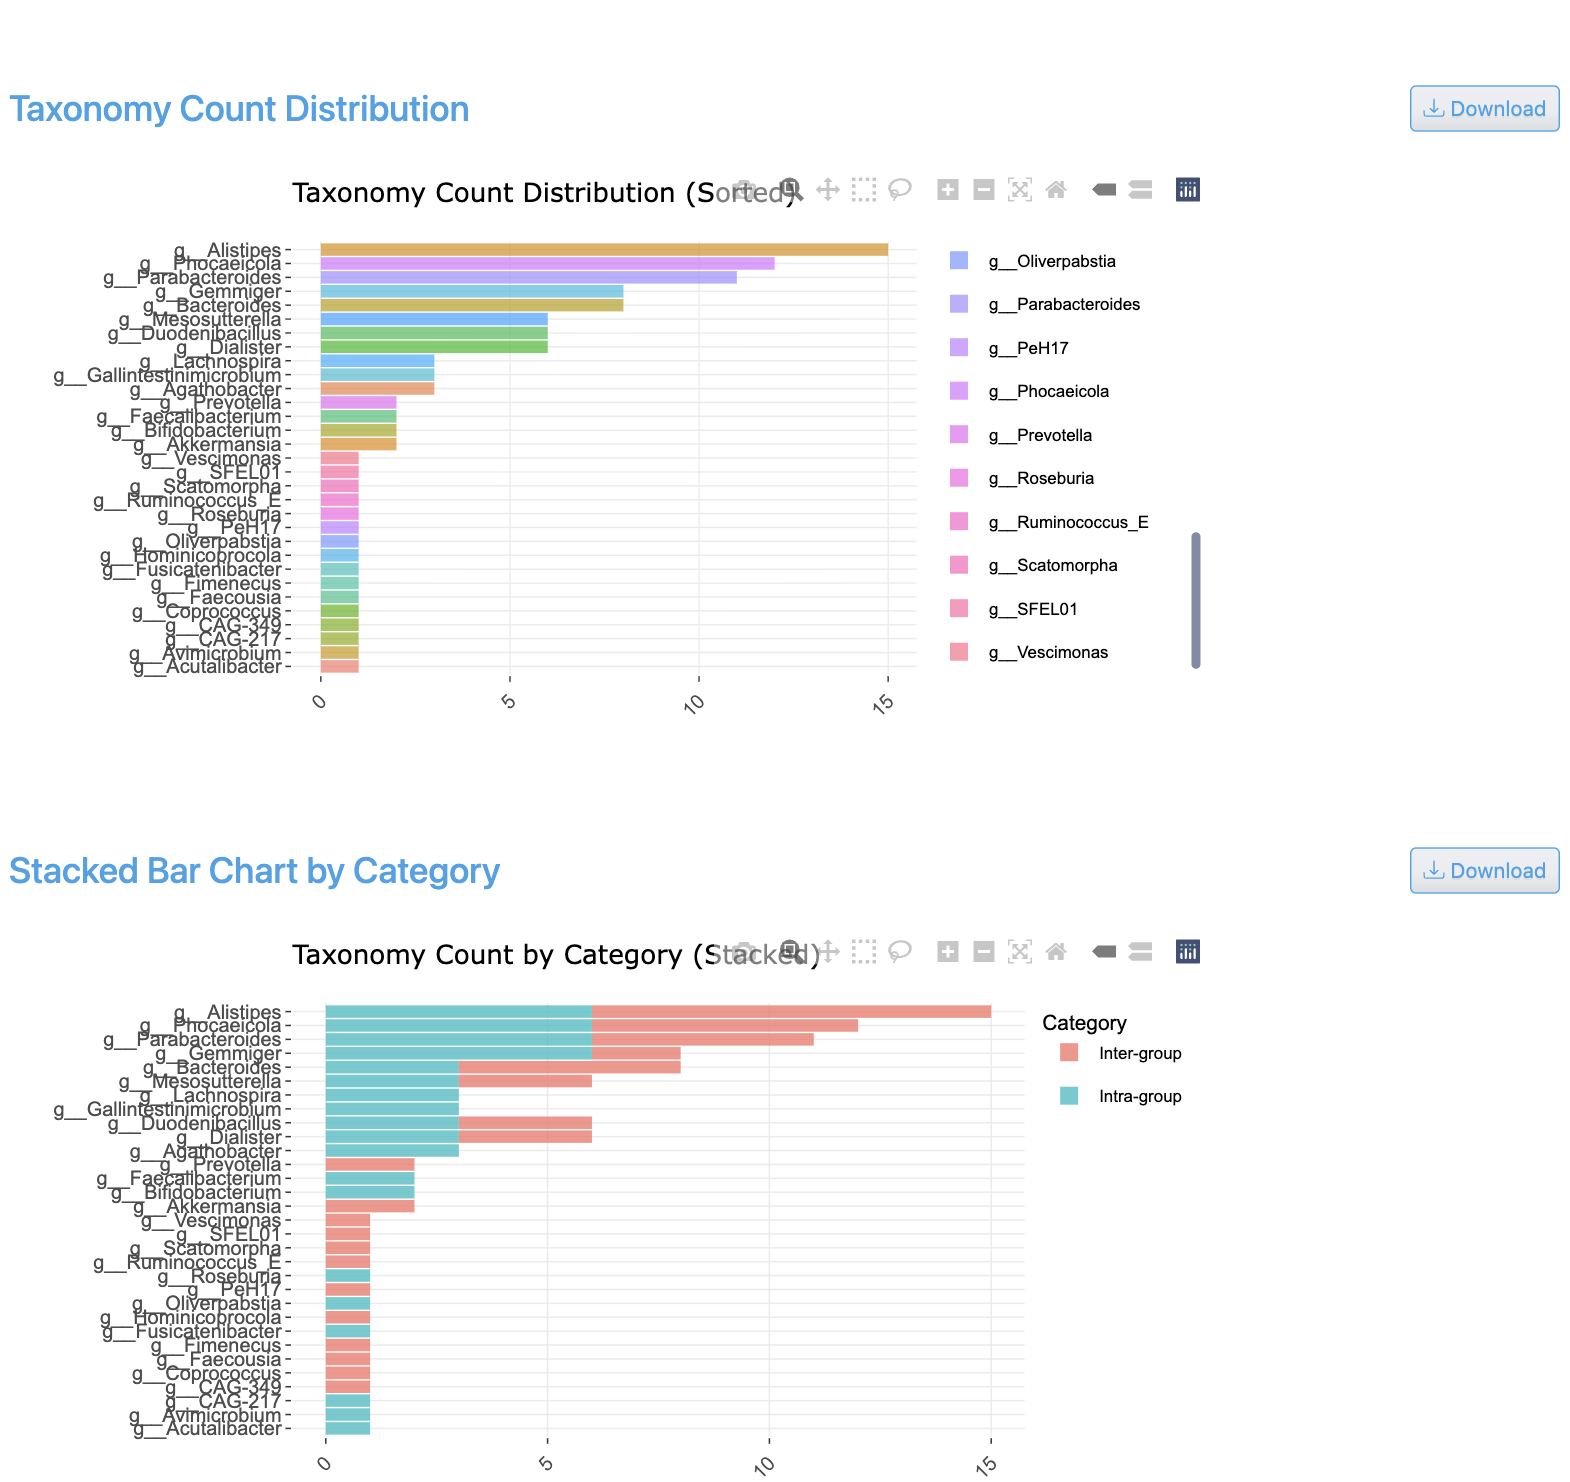
The group-based sharing analysis enables comparison of strain distribution patterns across metadata categories. It shows how genomes are distributed among different experimental conditions with statistical summaries.
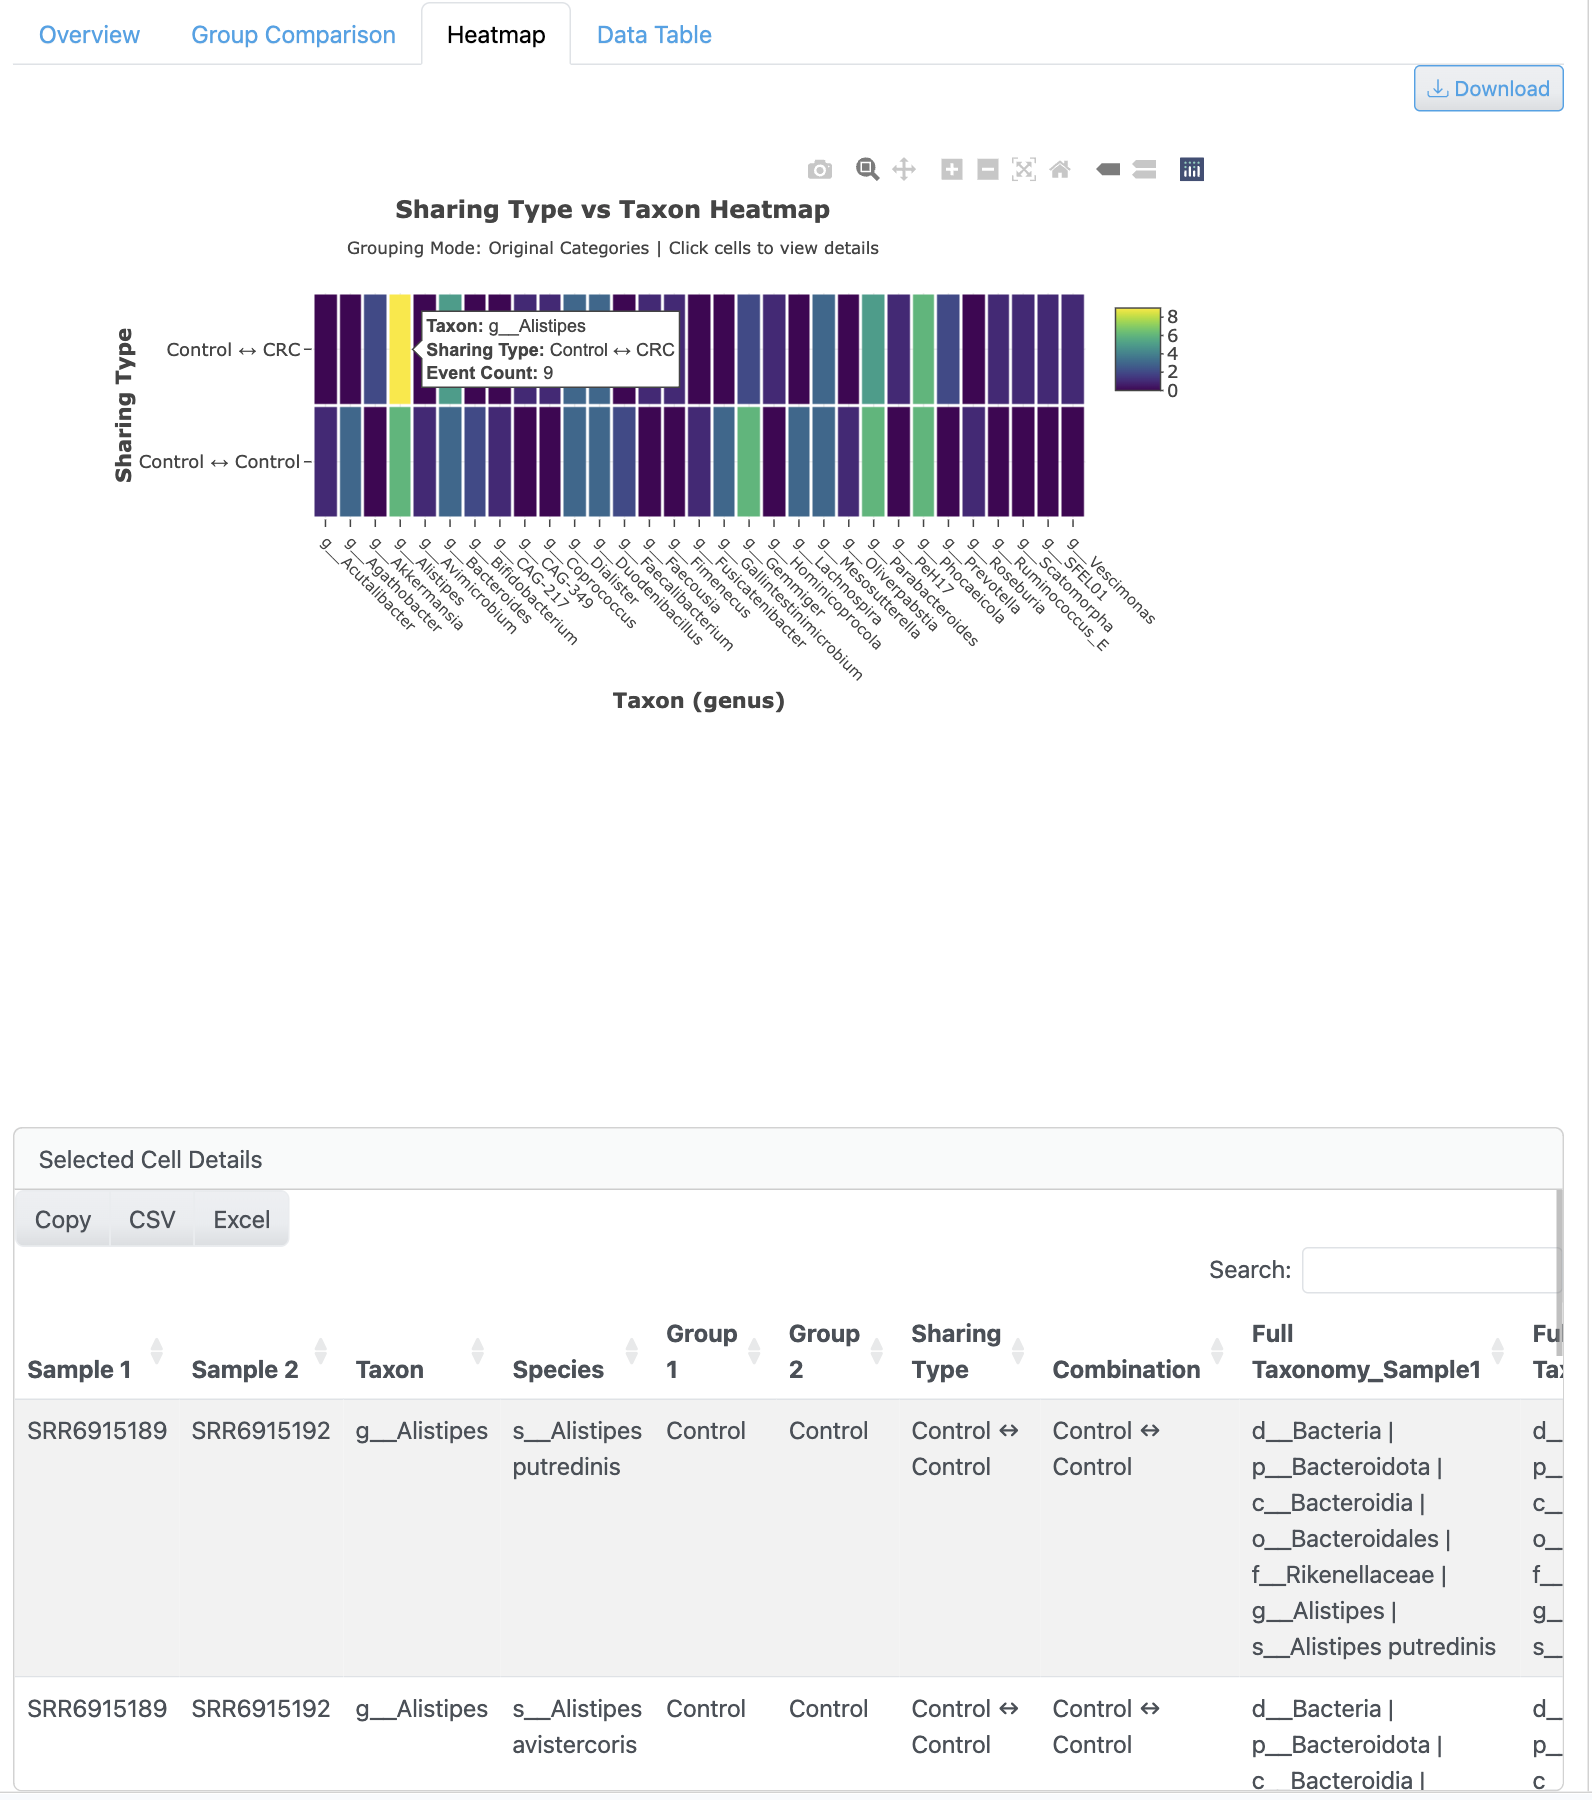
The presence/absence heatmap provides a matrix visualization of genome detection across all samples. Hierarchical clustering reveals sample grouping patterns, with color-coding indicating detection status and options for prevalence filtering.
Nucleotide Diversity Explorer#
Comprehensive analysis of within-population genetic diversity.
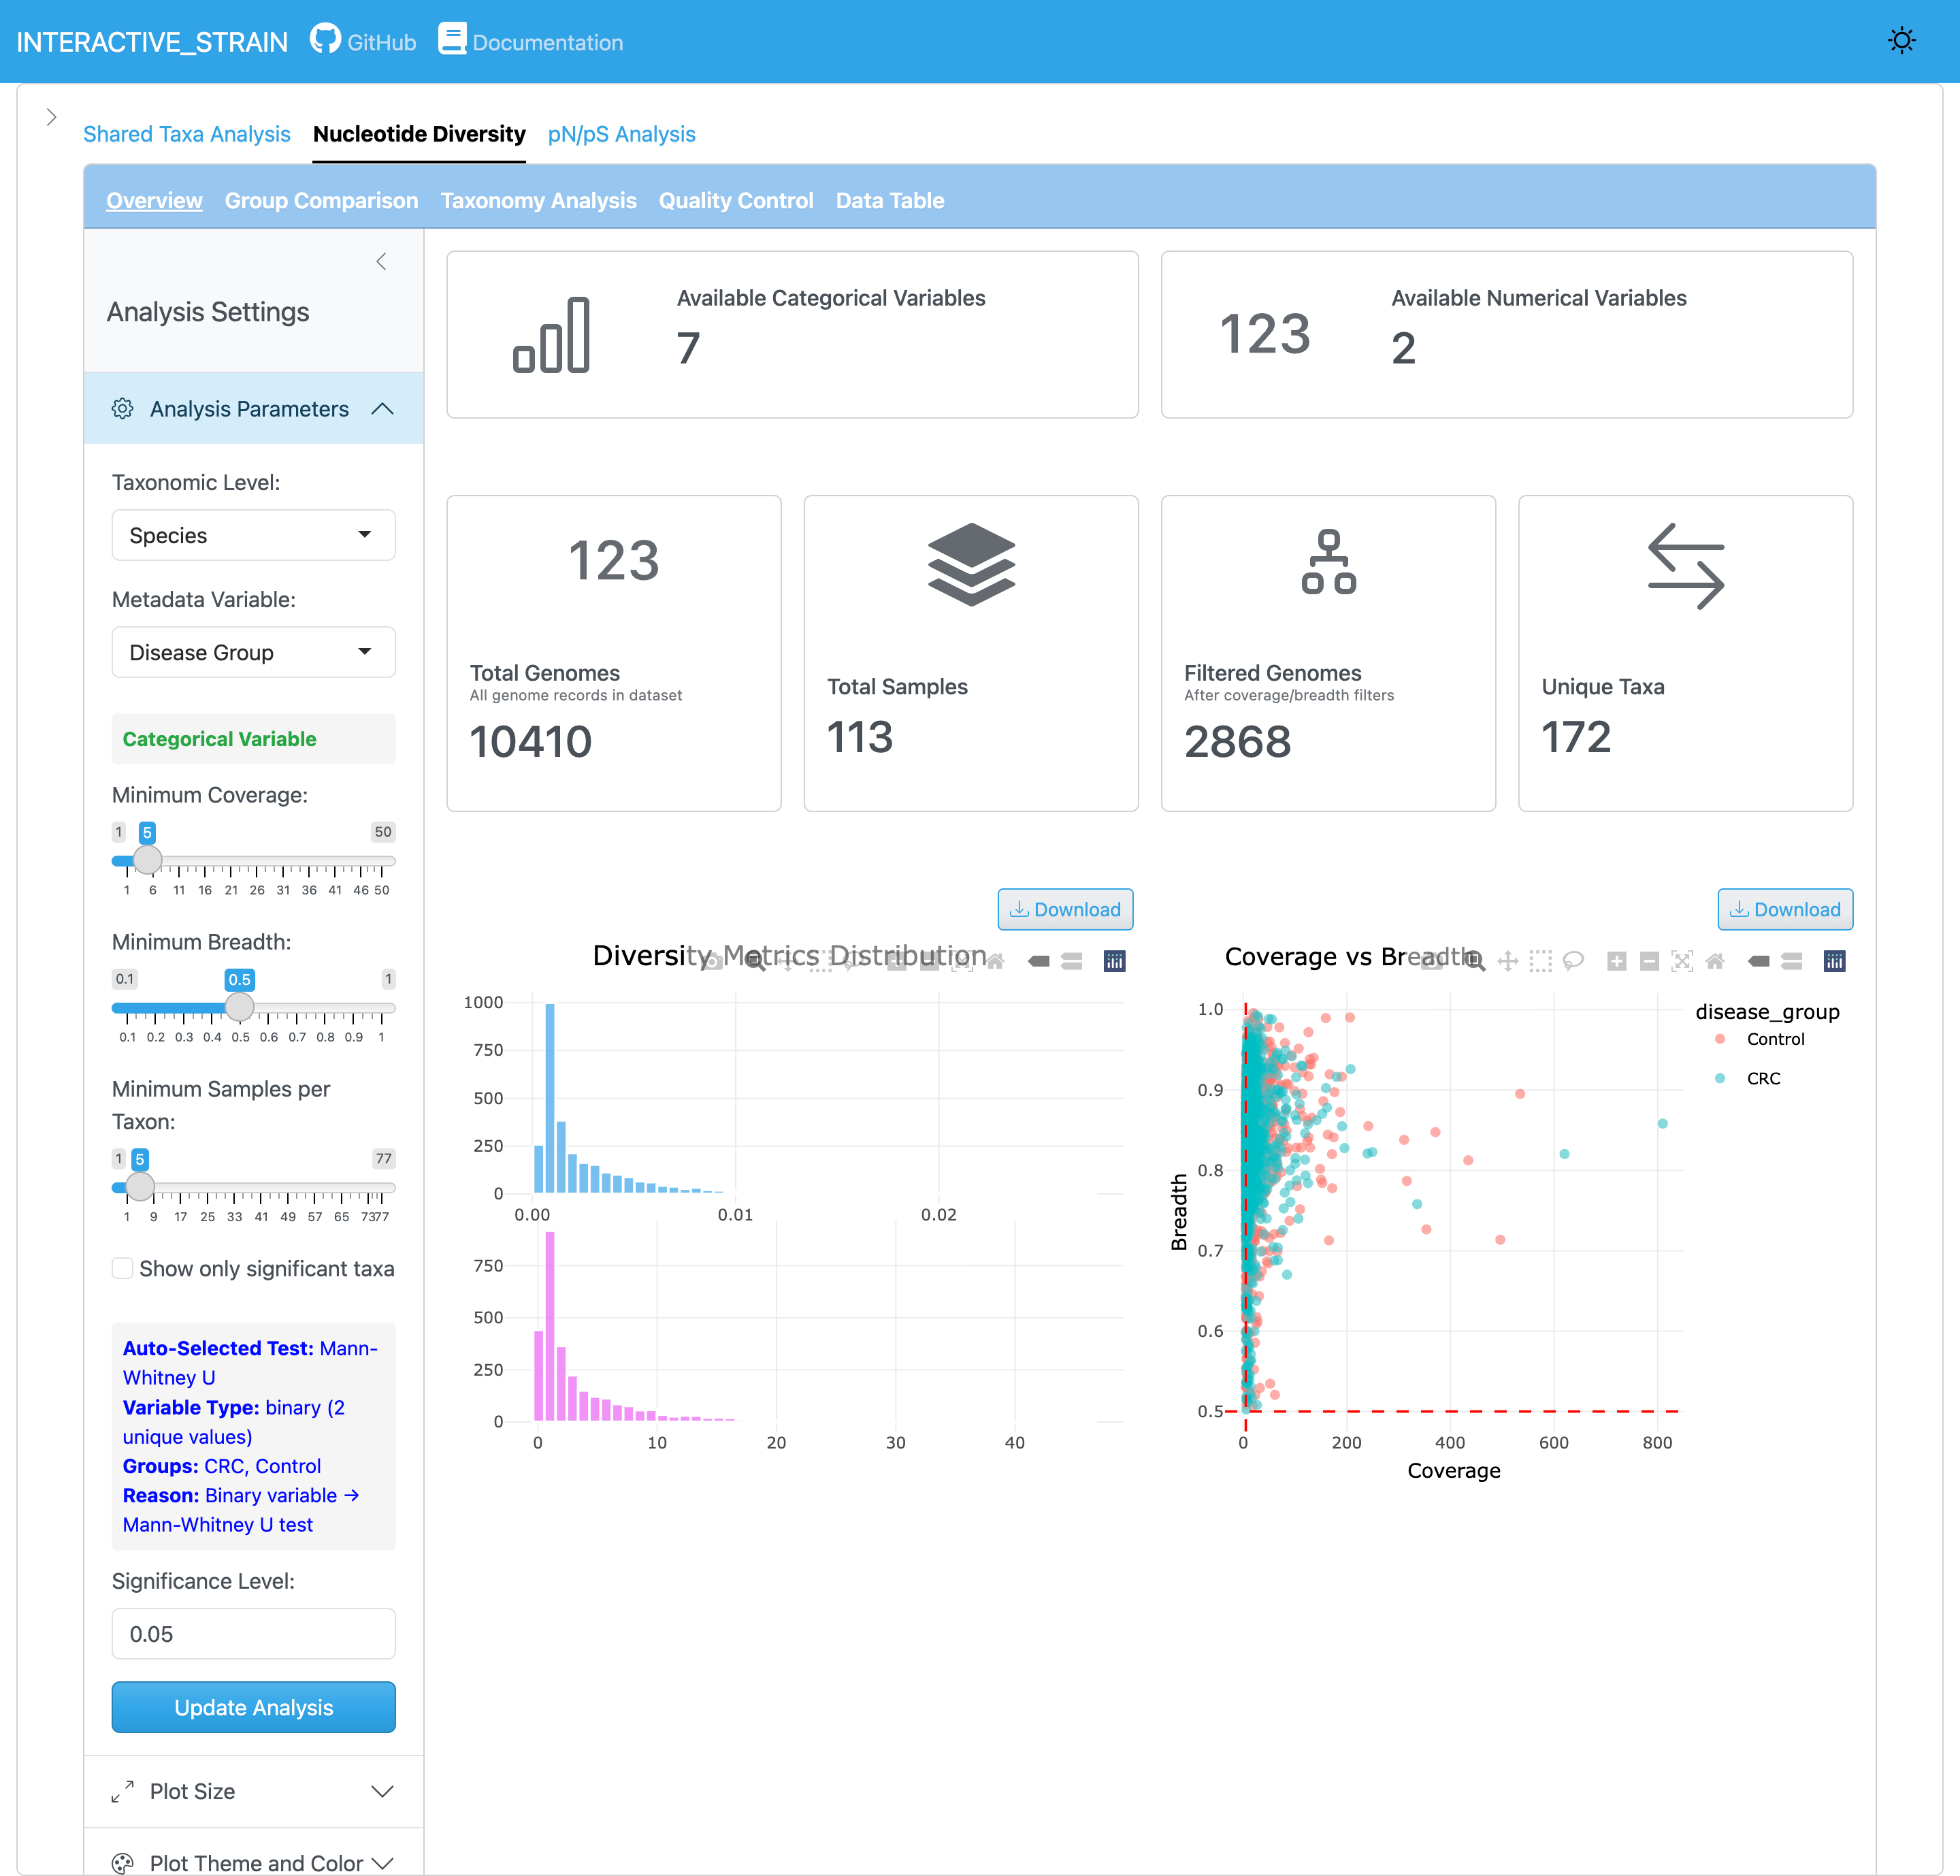
The overview panel displays the distribution of nucleotide diversity (π) values across all genomes and samples. InStrain calculates nucleotide diversity using the Nei and Li (1979) method: π = 1 - Σ(frequency of each base)², computed at every genomic position with sufficient coverage (default ≥5x) and averaged across genes/genomes. This metric quantifies within-population genetic variation and is robust to coverage differences between samples. The panel provides summary statistics and quality filtering options for reliable microdiversity estimates.
The diversity distribution view shows detailed nucleotide diversity patterns with histograms and density plots. Users can explore the range of diversity values and identify genomes with high or low microdiversity.
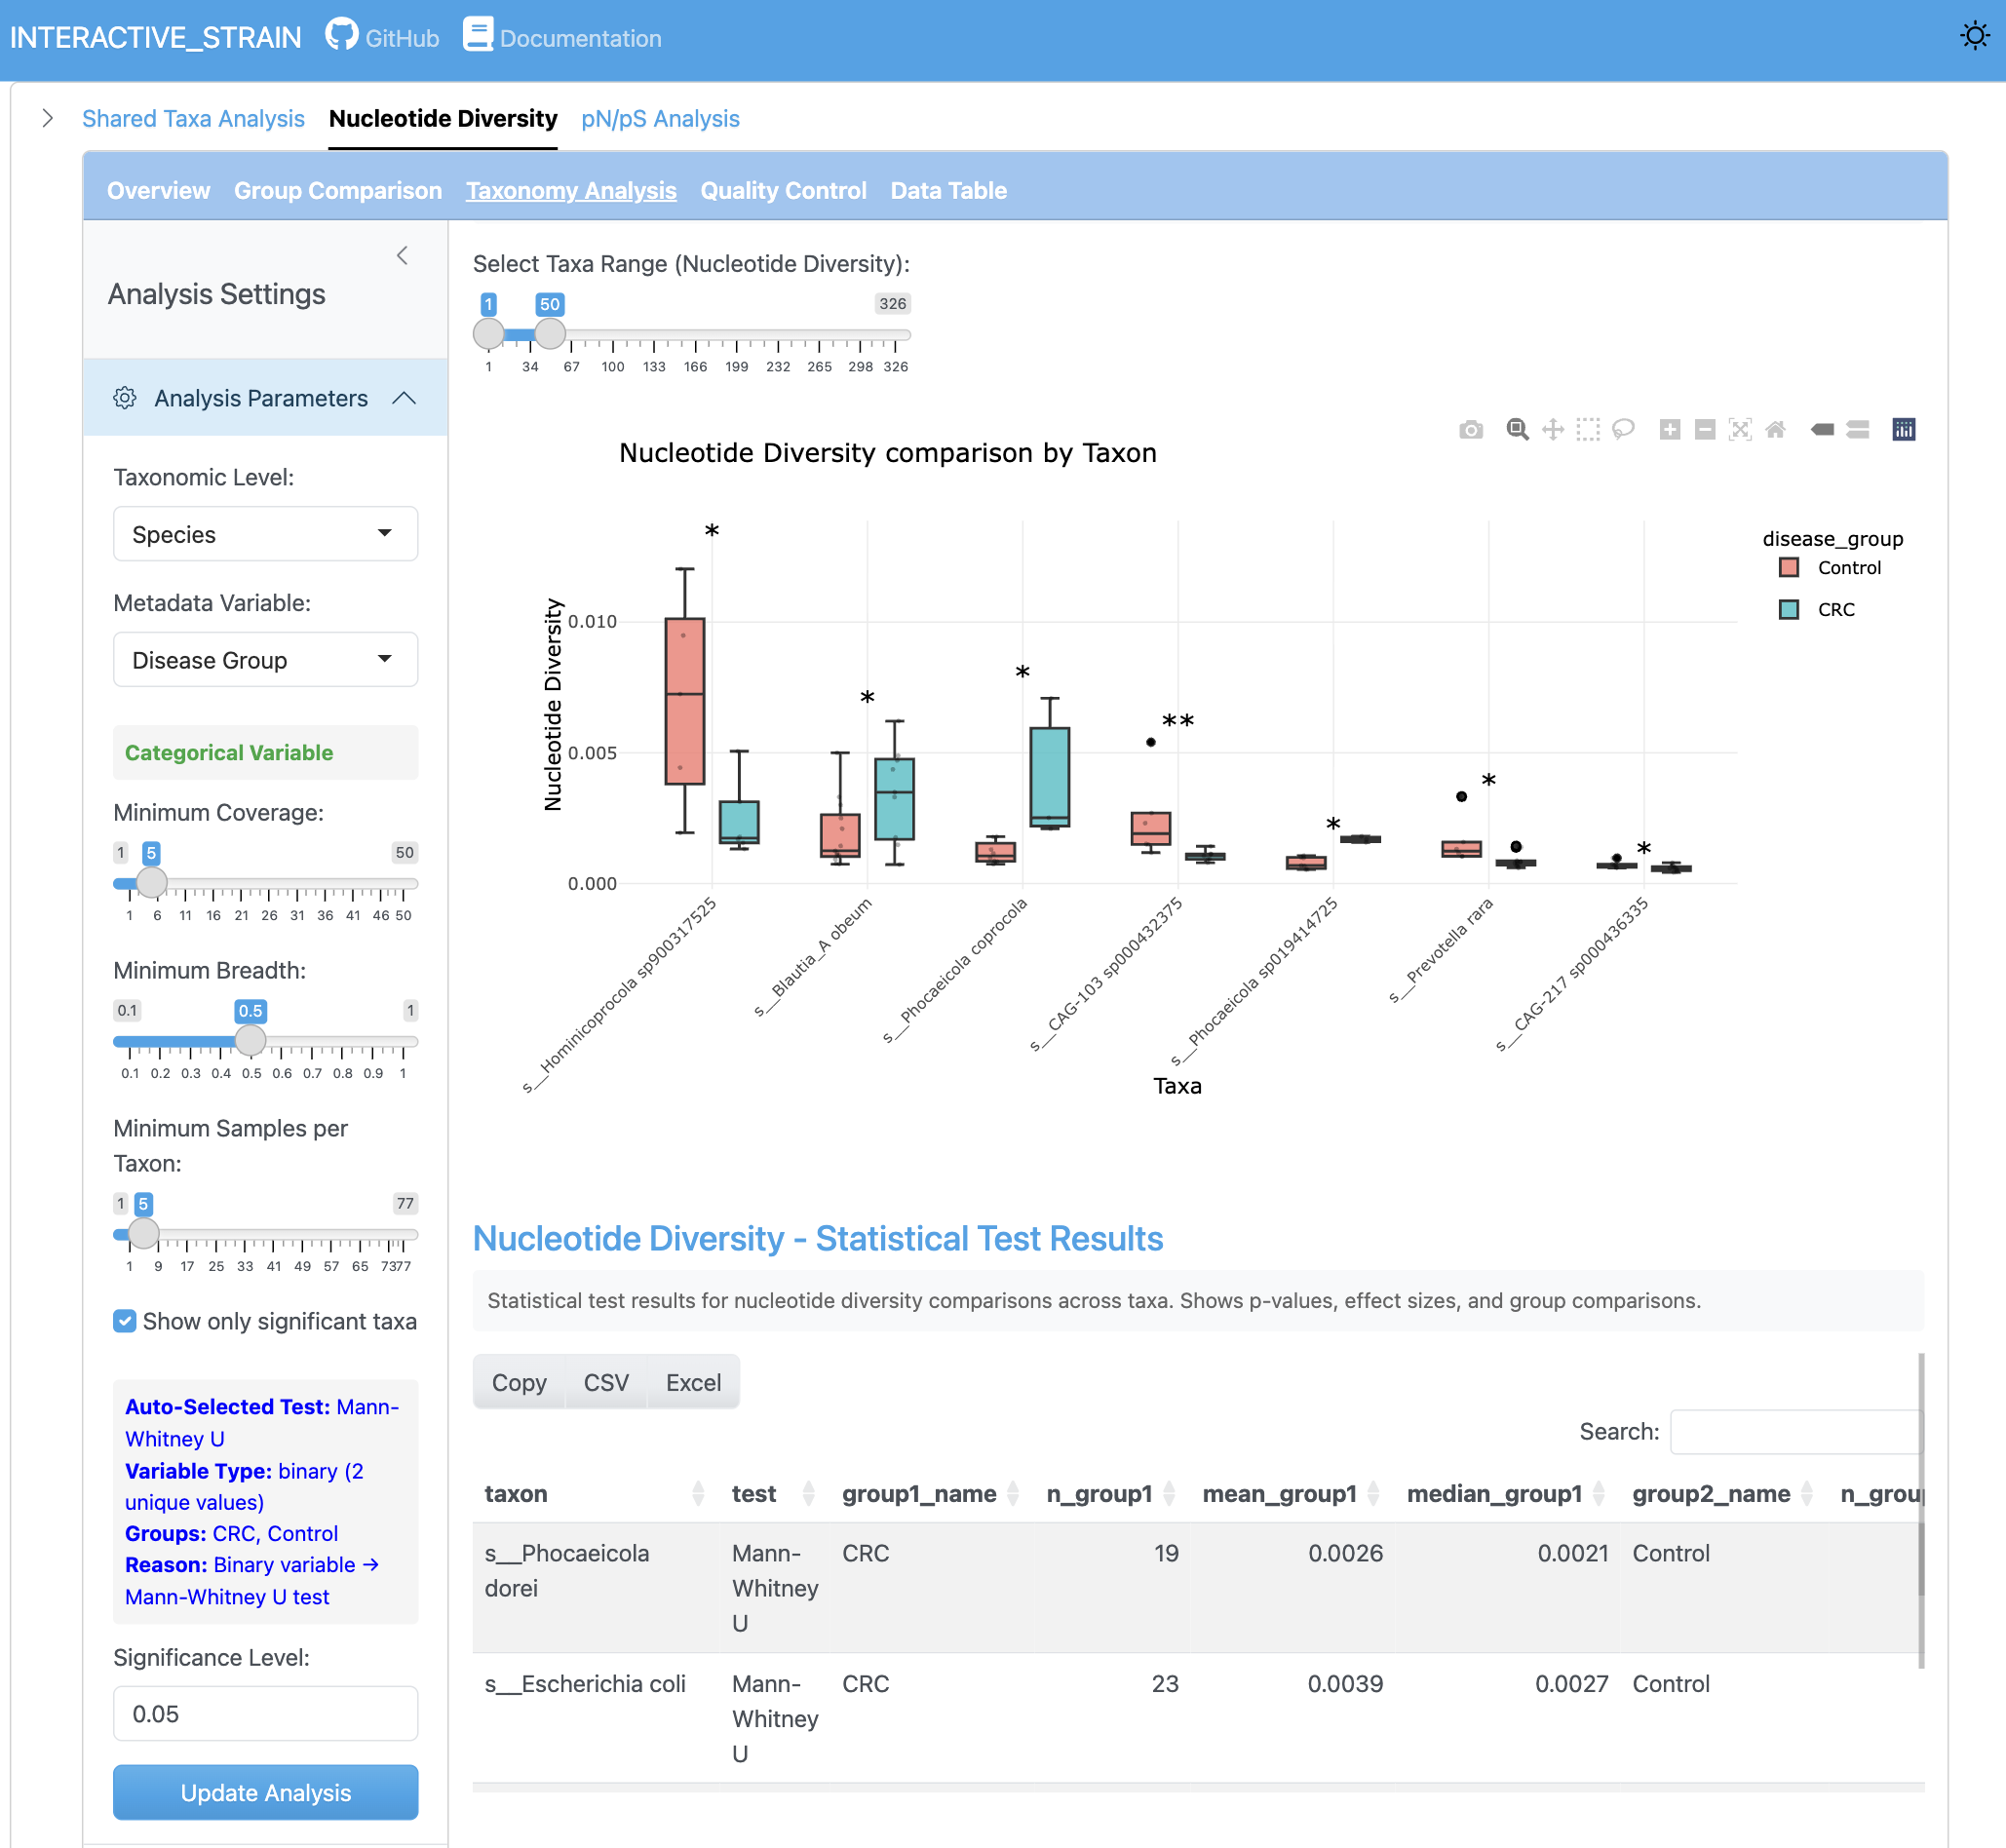
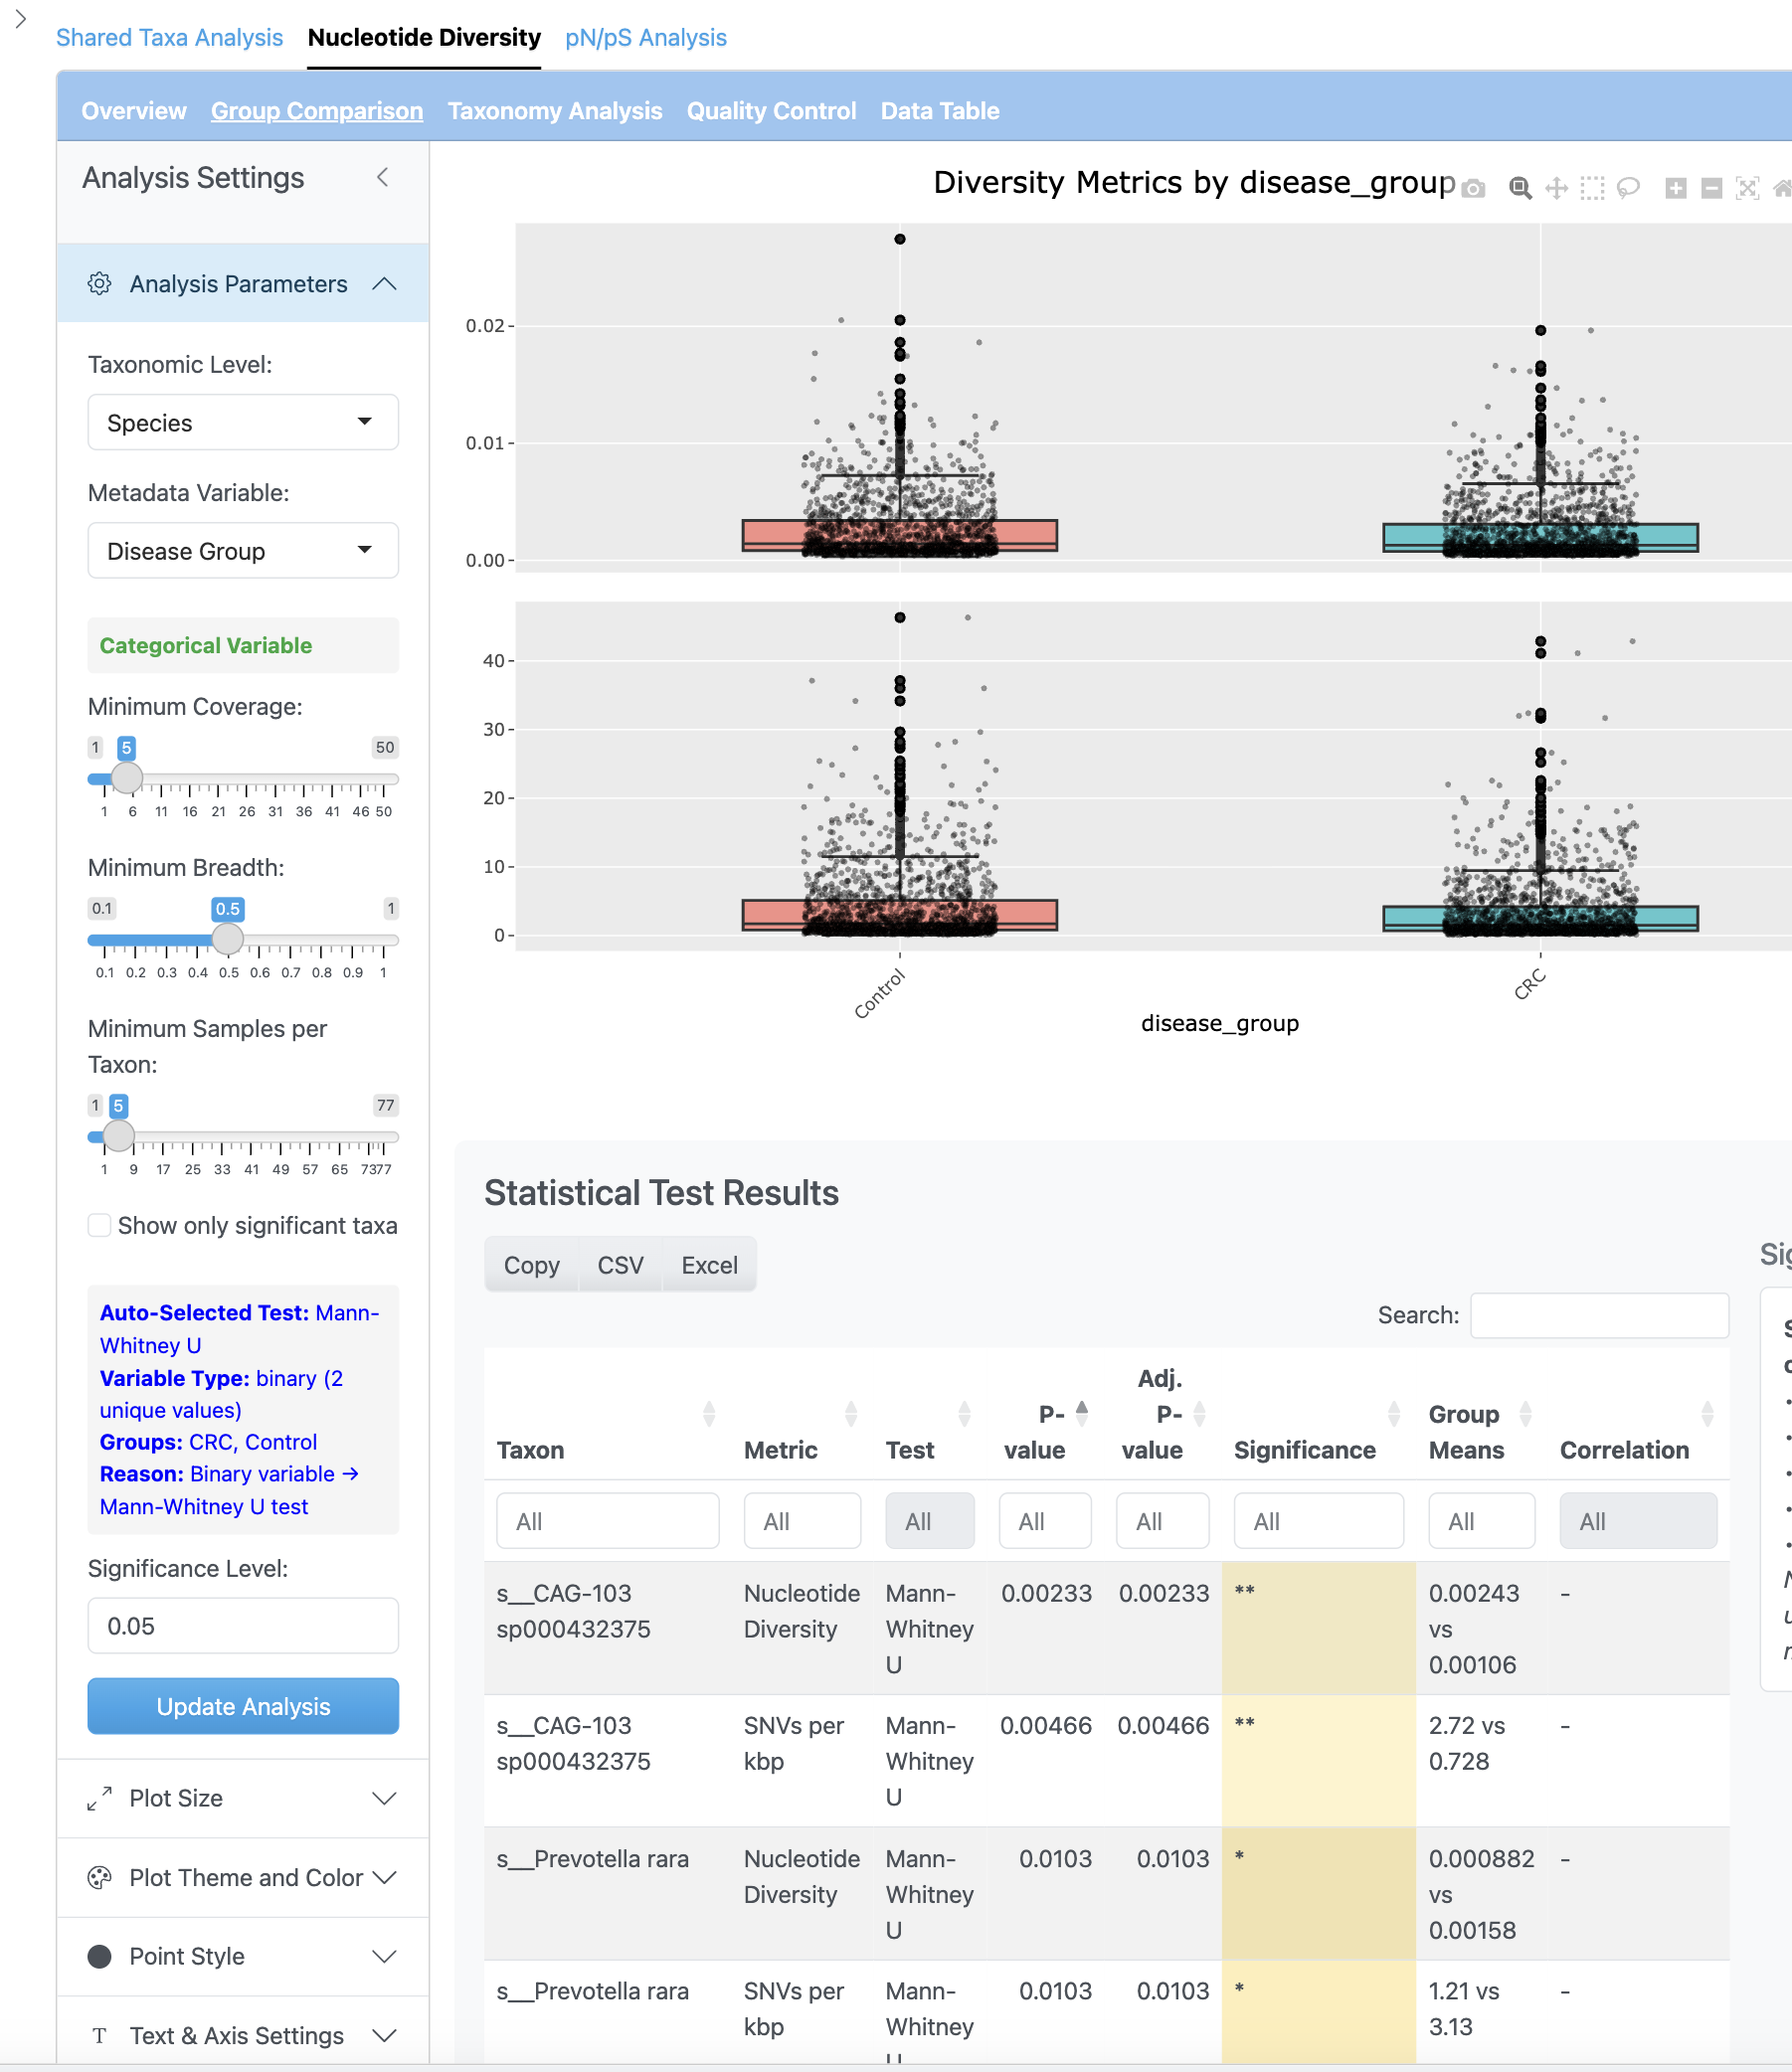
The group comparison view presents boxplots comparing nucleotide diversity between metadata groups. Statistical tests (Wilcoxon, Kruskal-Wallis) are performed with effect size calculations and multiple testing correction options.
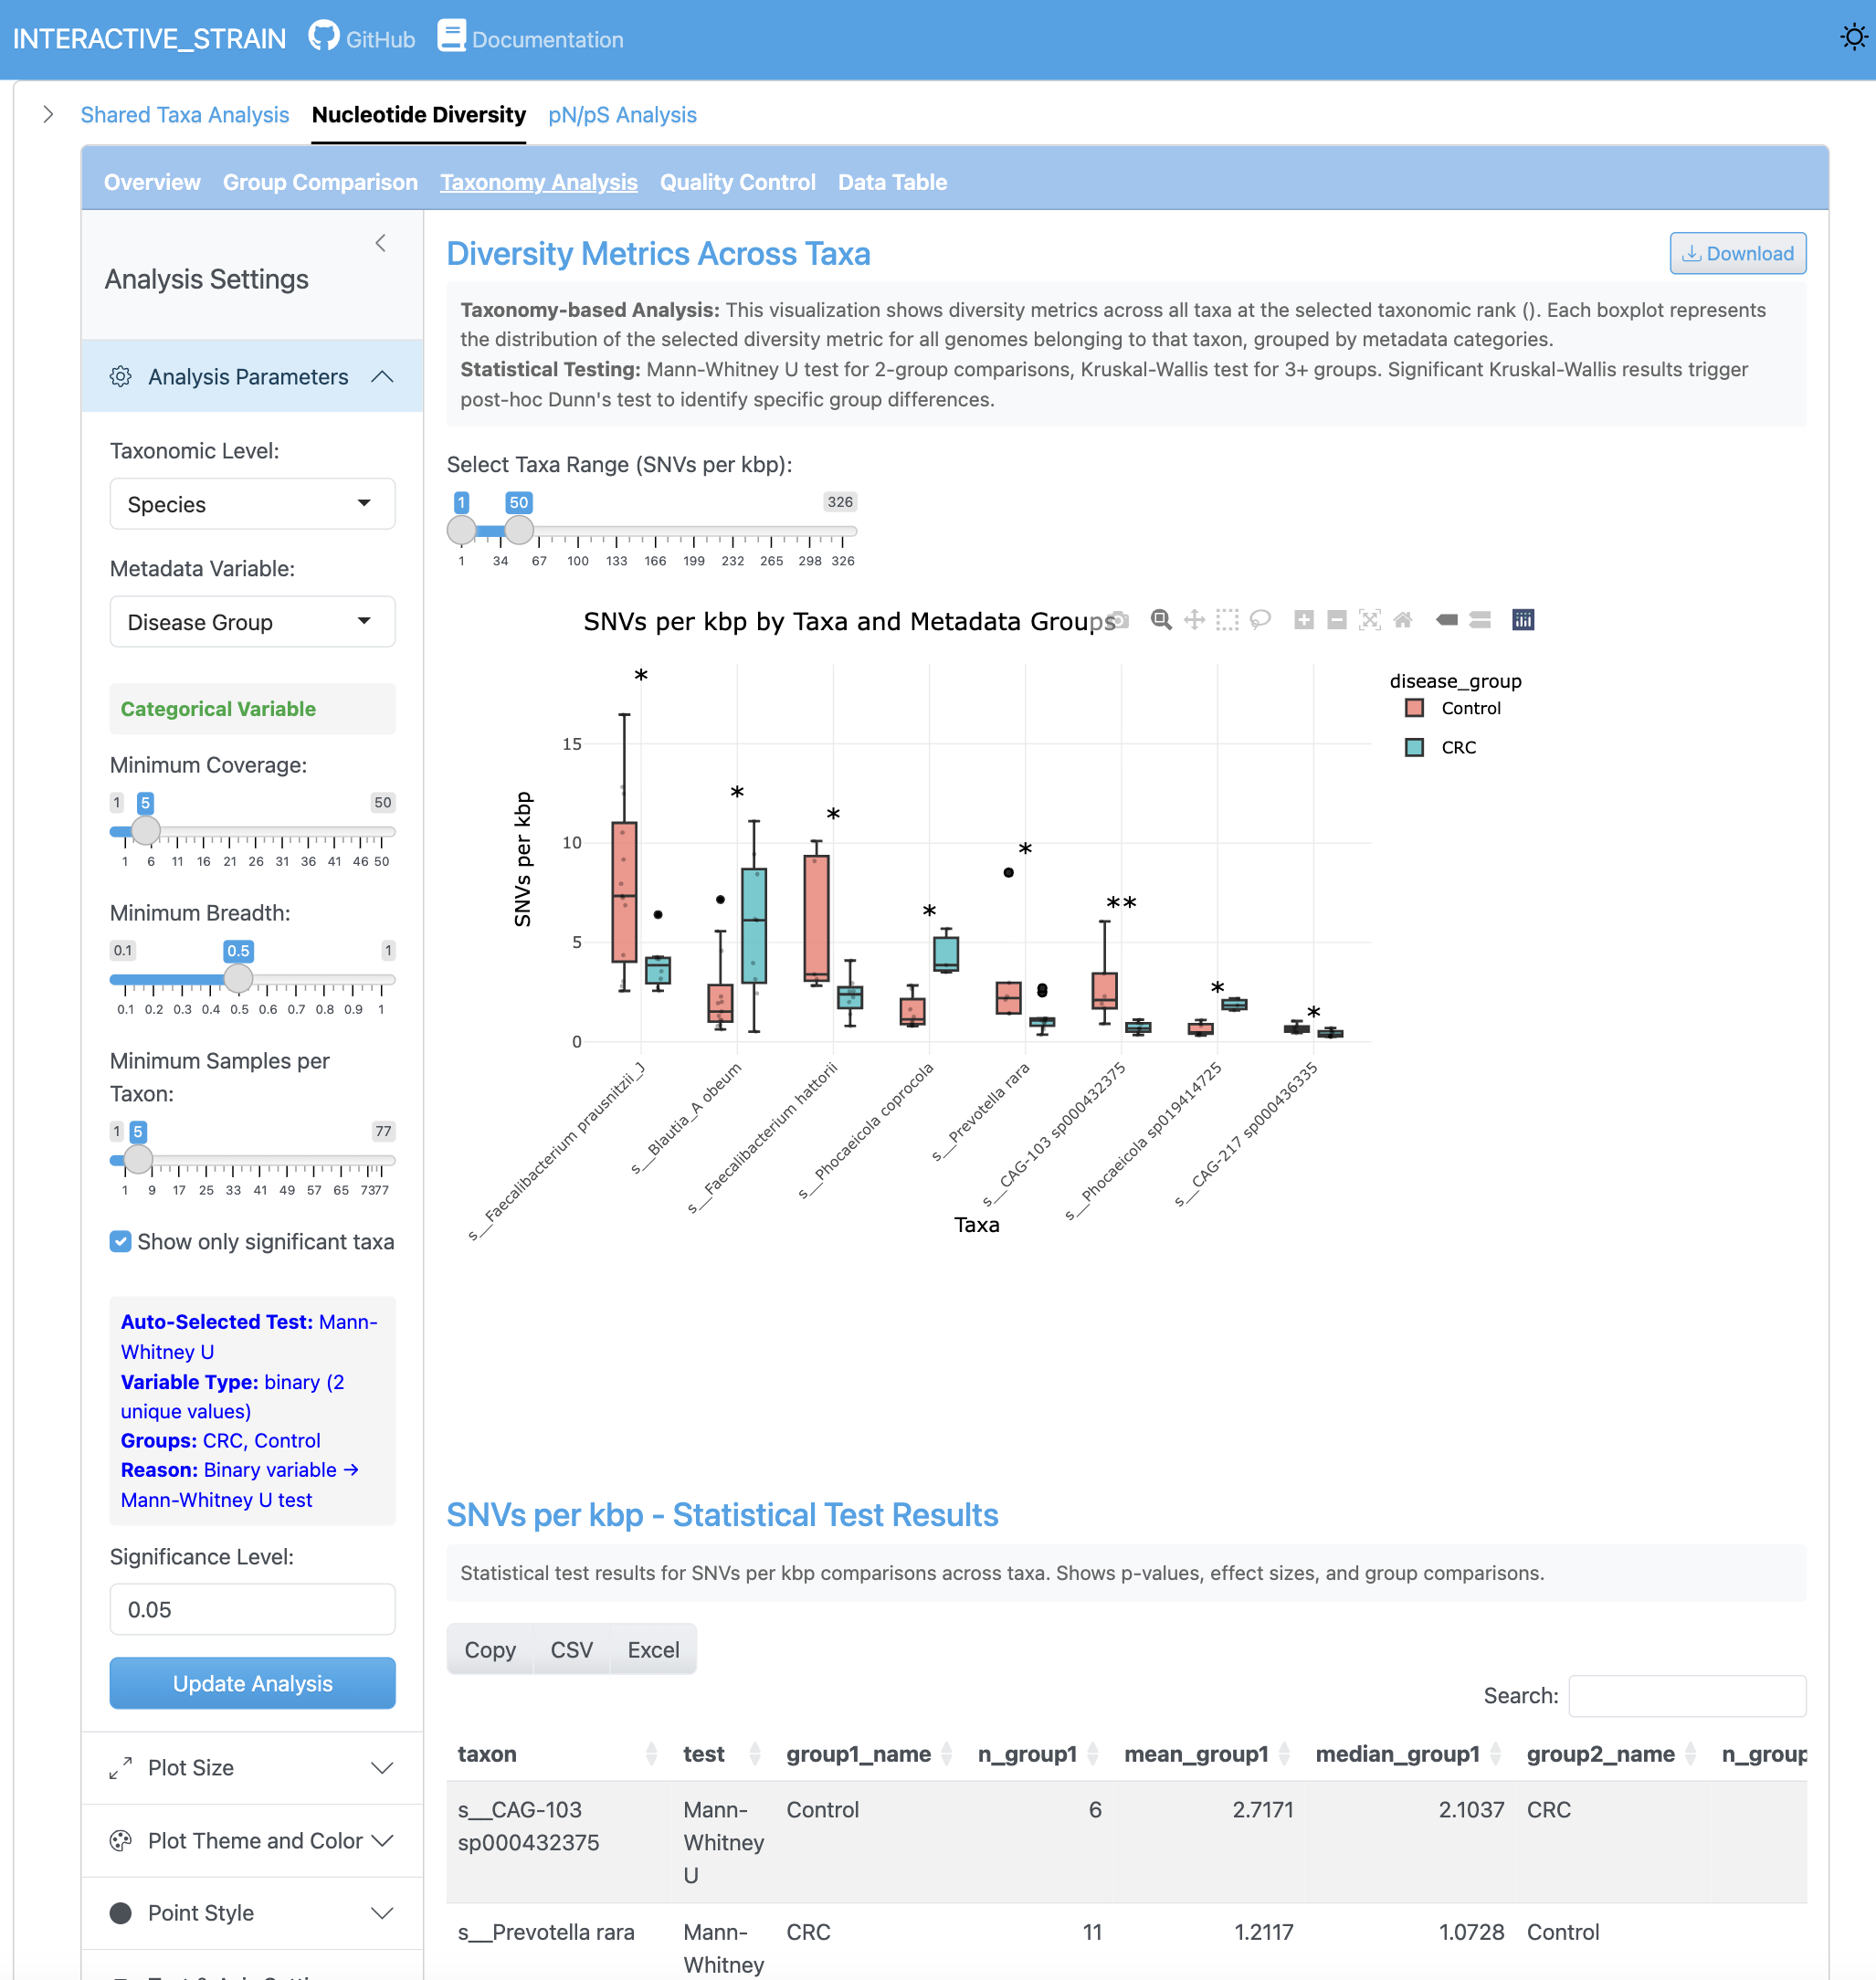
The SNV density analysis shows the number of single nucleotide variants per kilobase pair across genomes and samples. This metric provides insight into mutation rates and population-level genetic variation.
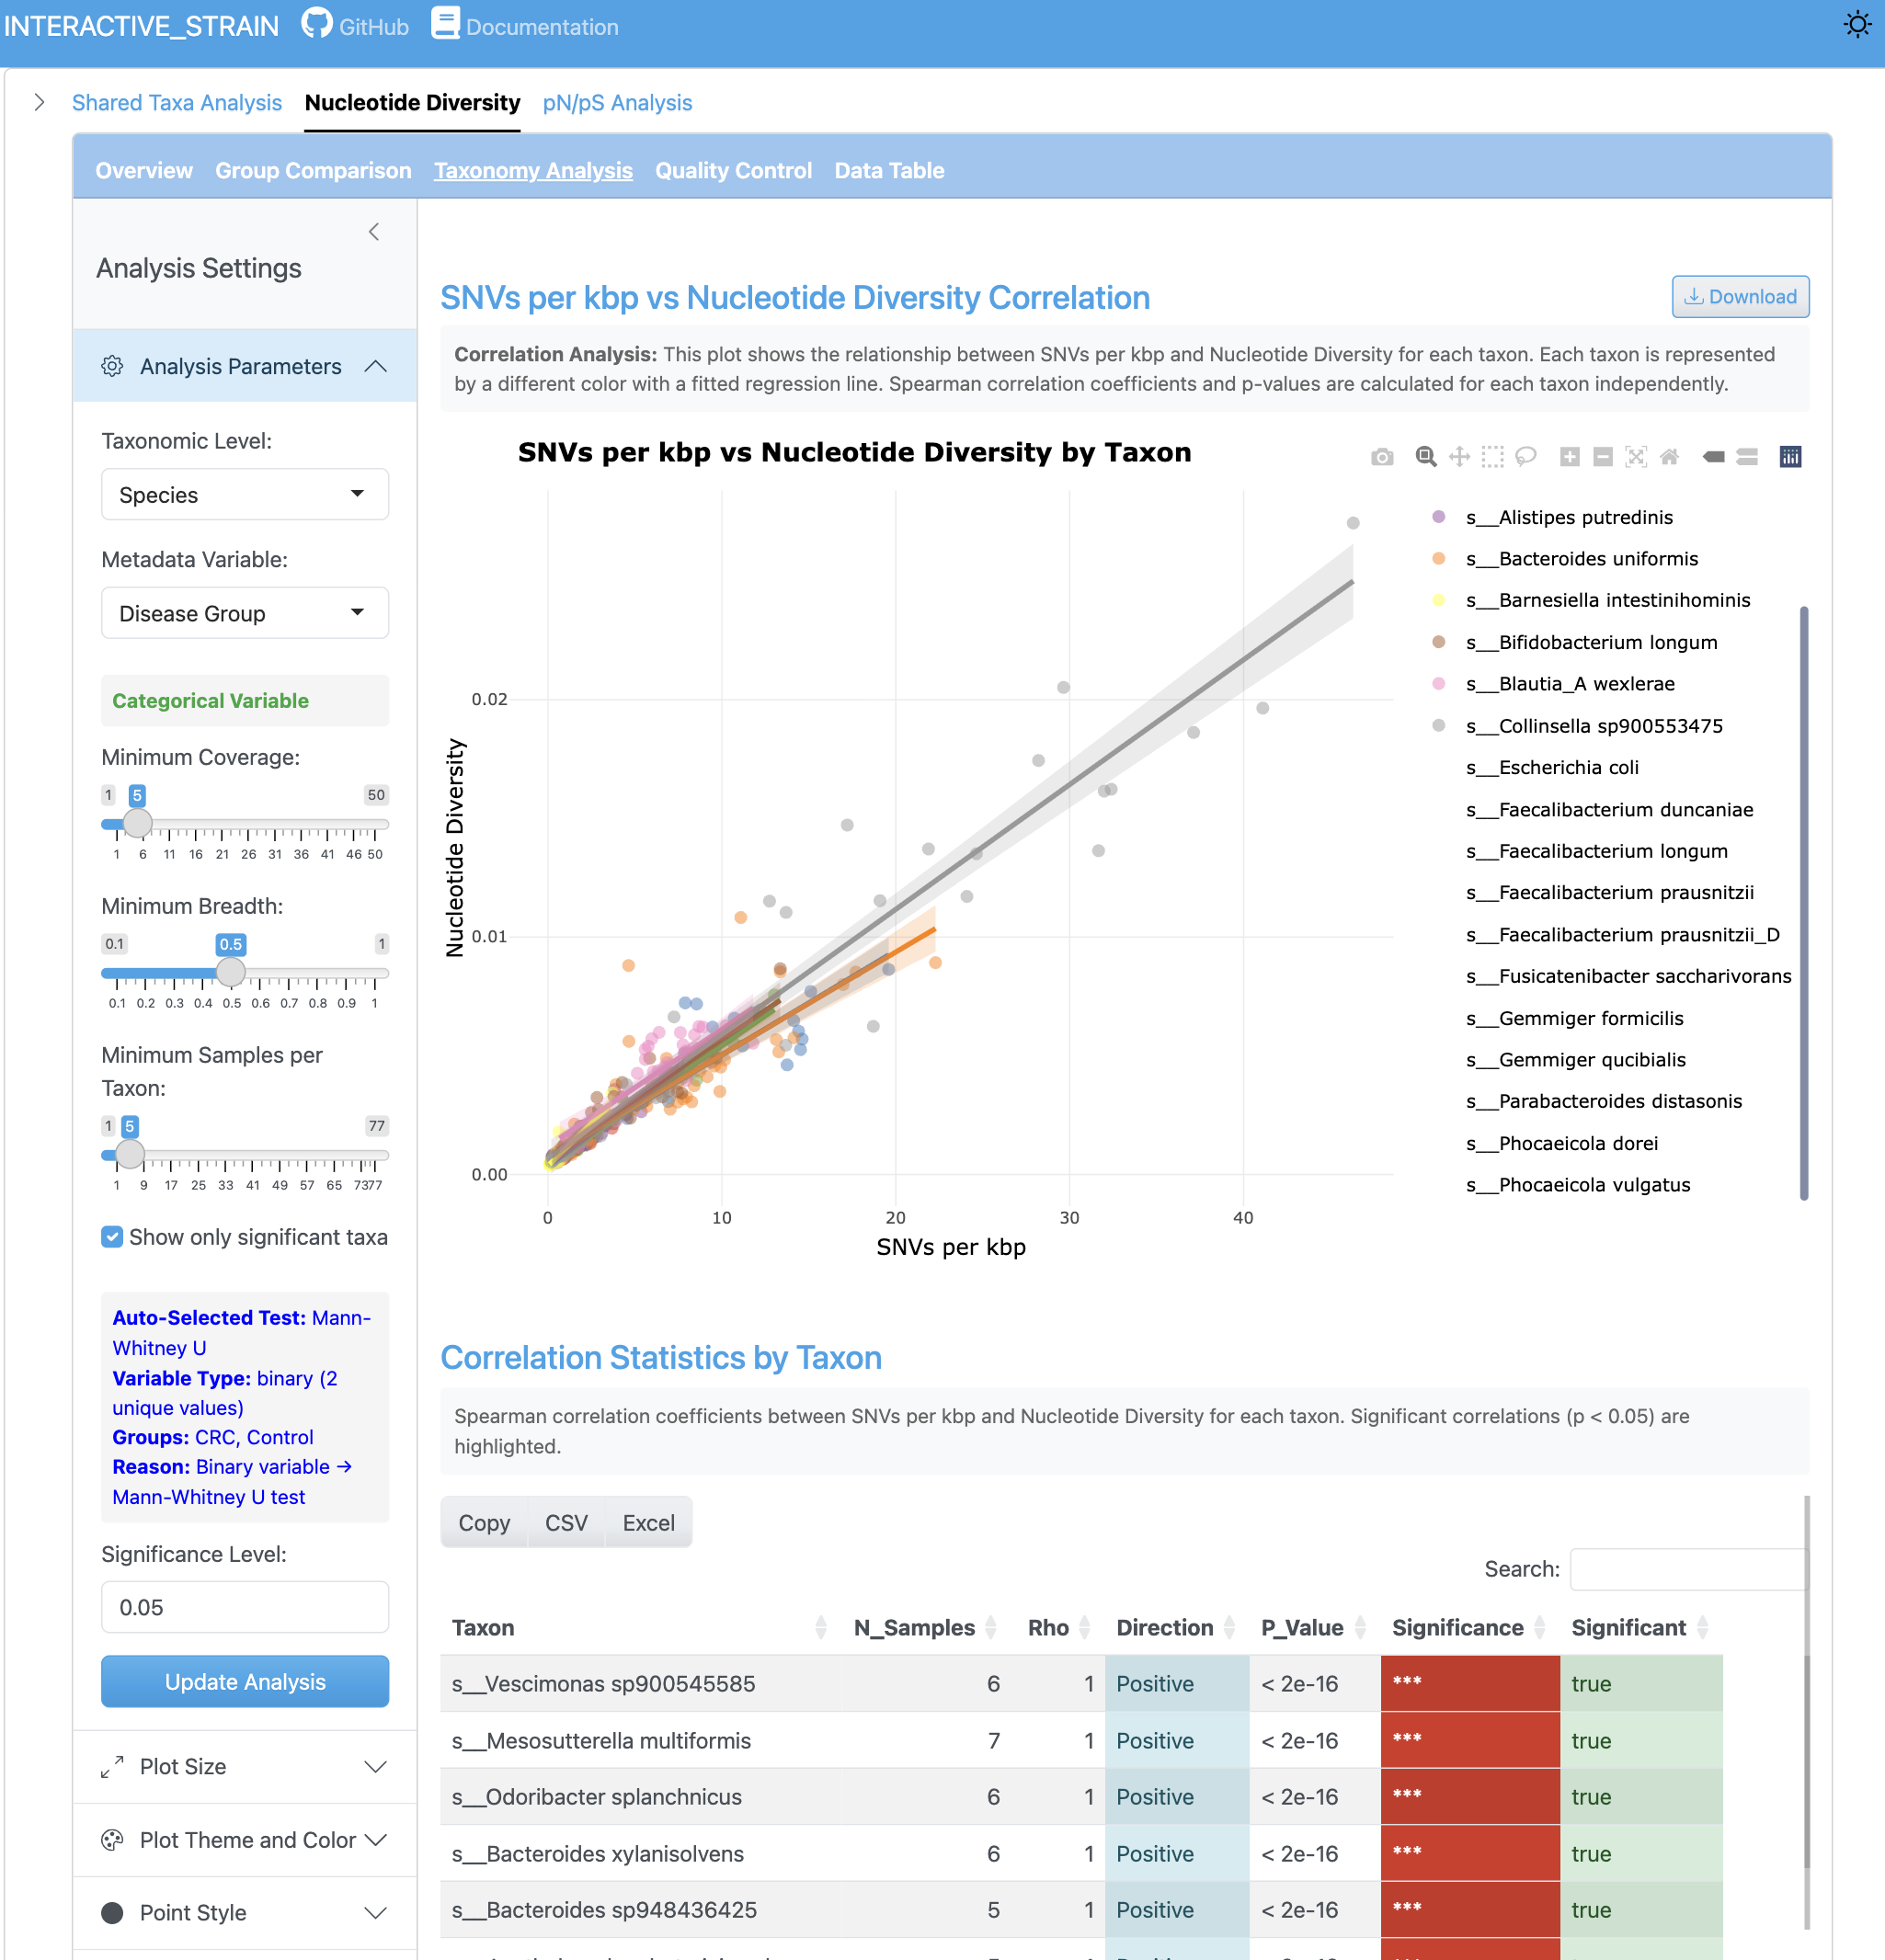
The correlation view displays the relationship between SNV counts and nucleotide diversity metrics. Scatterplots with regression lines reveal how these metrics relate across different genomes and sample conditions.
pN/pS Analysis#
Selection pressure analysis at multiple levels.
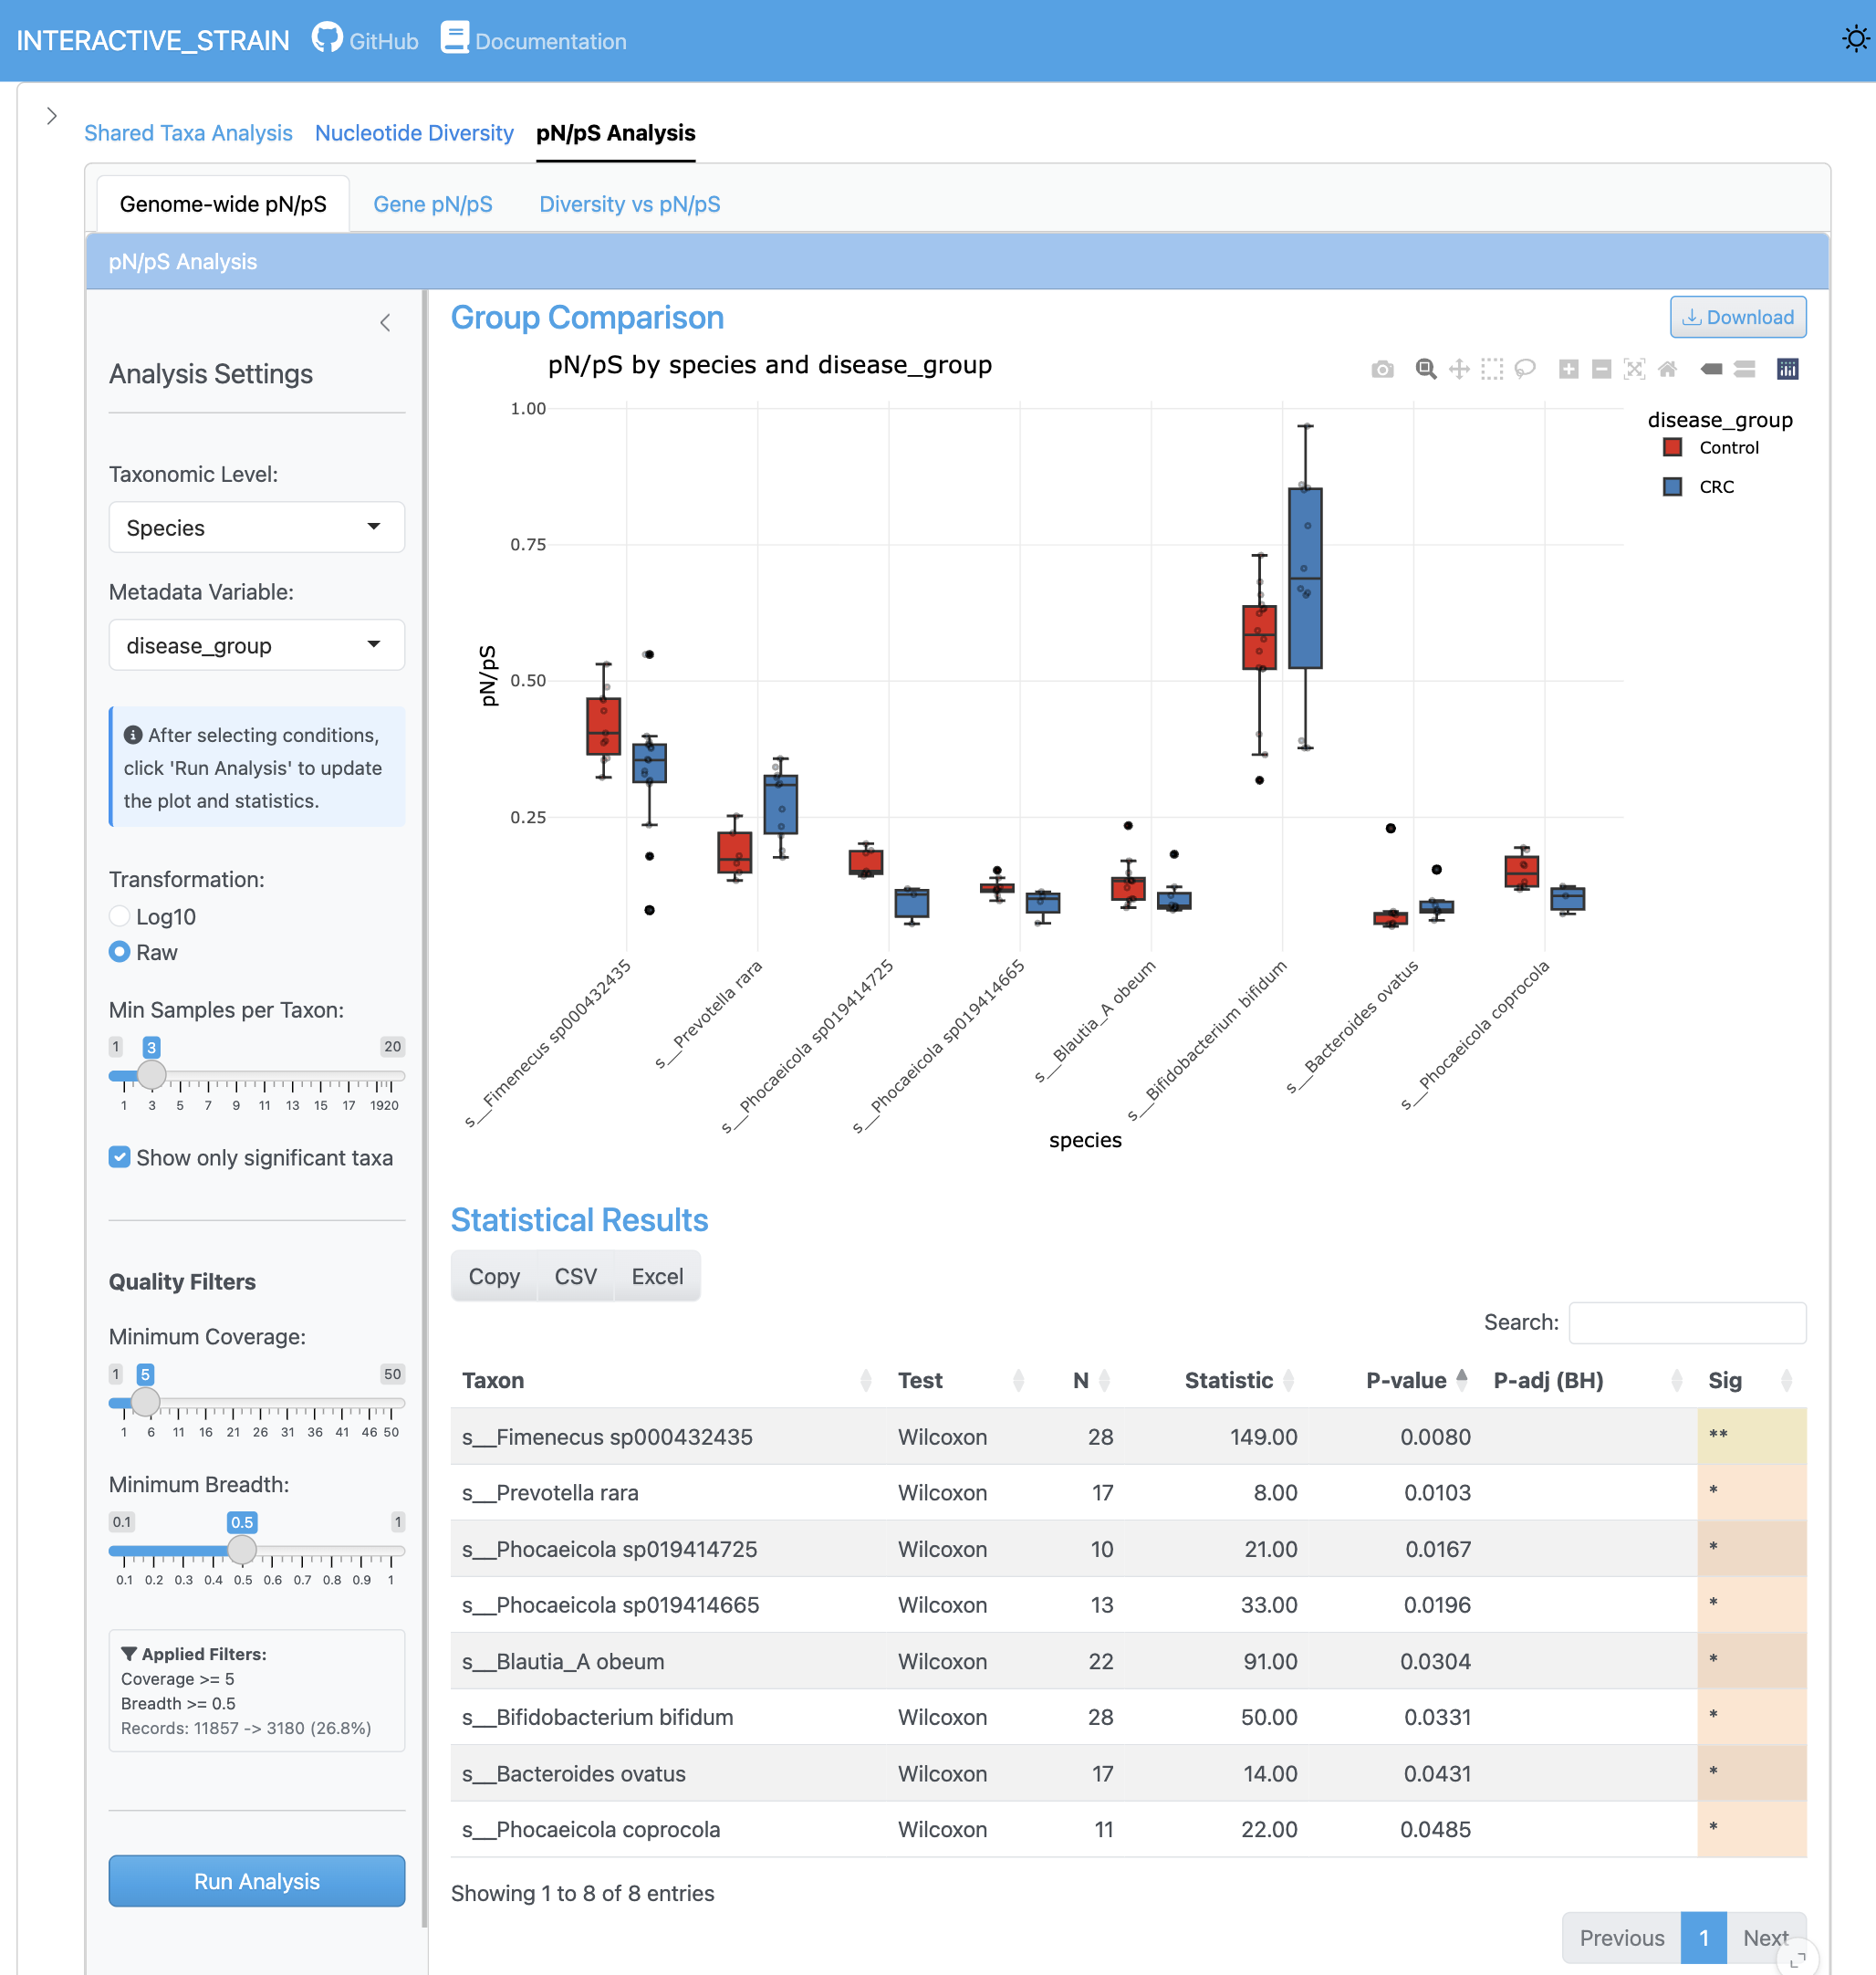
The genome-wide pN/pS analysis displays the distribution of pN/pS ratios across all genomes, identifying genomes under selection pressure. Group comparisons with statistical significance testing reveal differential selection patterns between conditions.
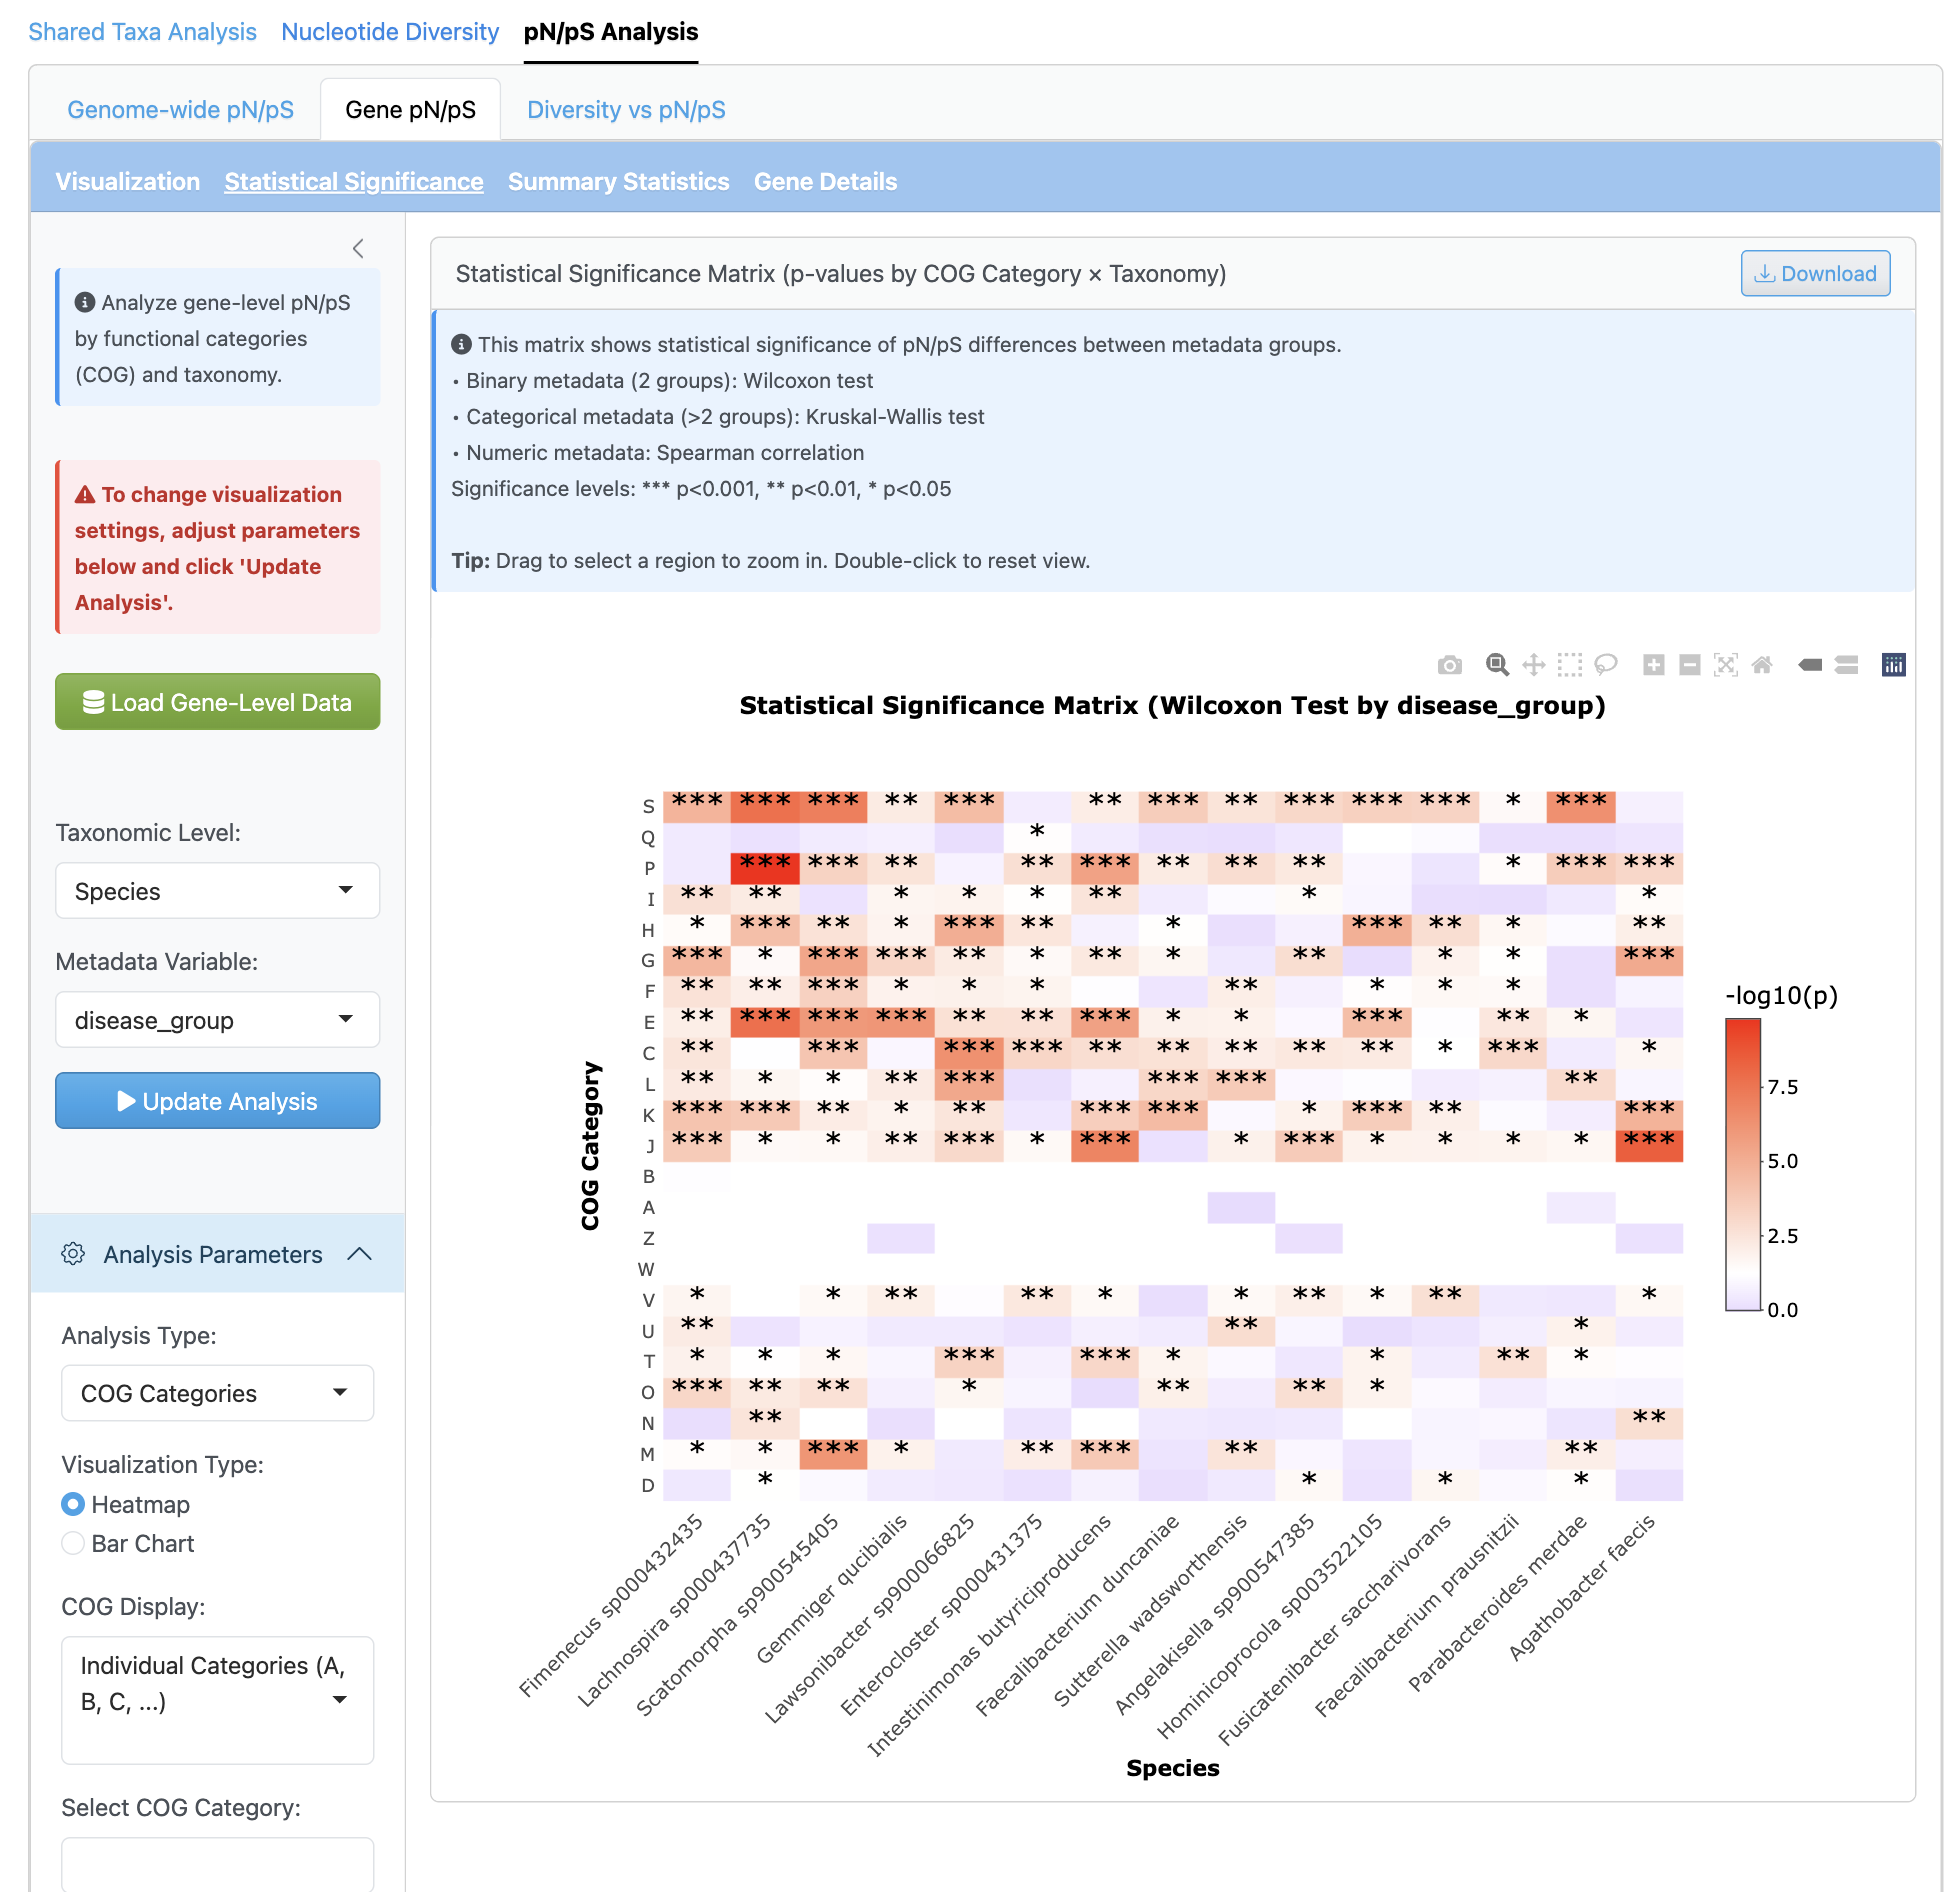
The gene-level analysis provides fine-scale selection pressure investigation per gene with functional annotation integration (COG categories). Heatmap visualizations by functional category enable identification of genes under positive or purifying selection.
Diversity vs pN/pS Correlation#
Integrated analysis of diversity and selection.
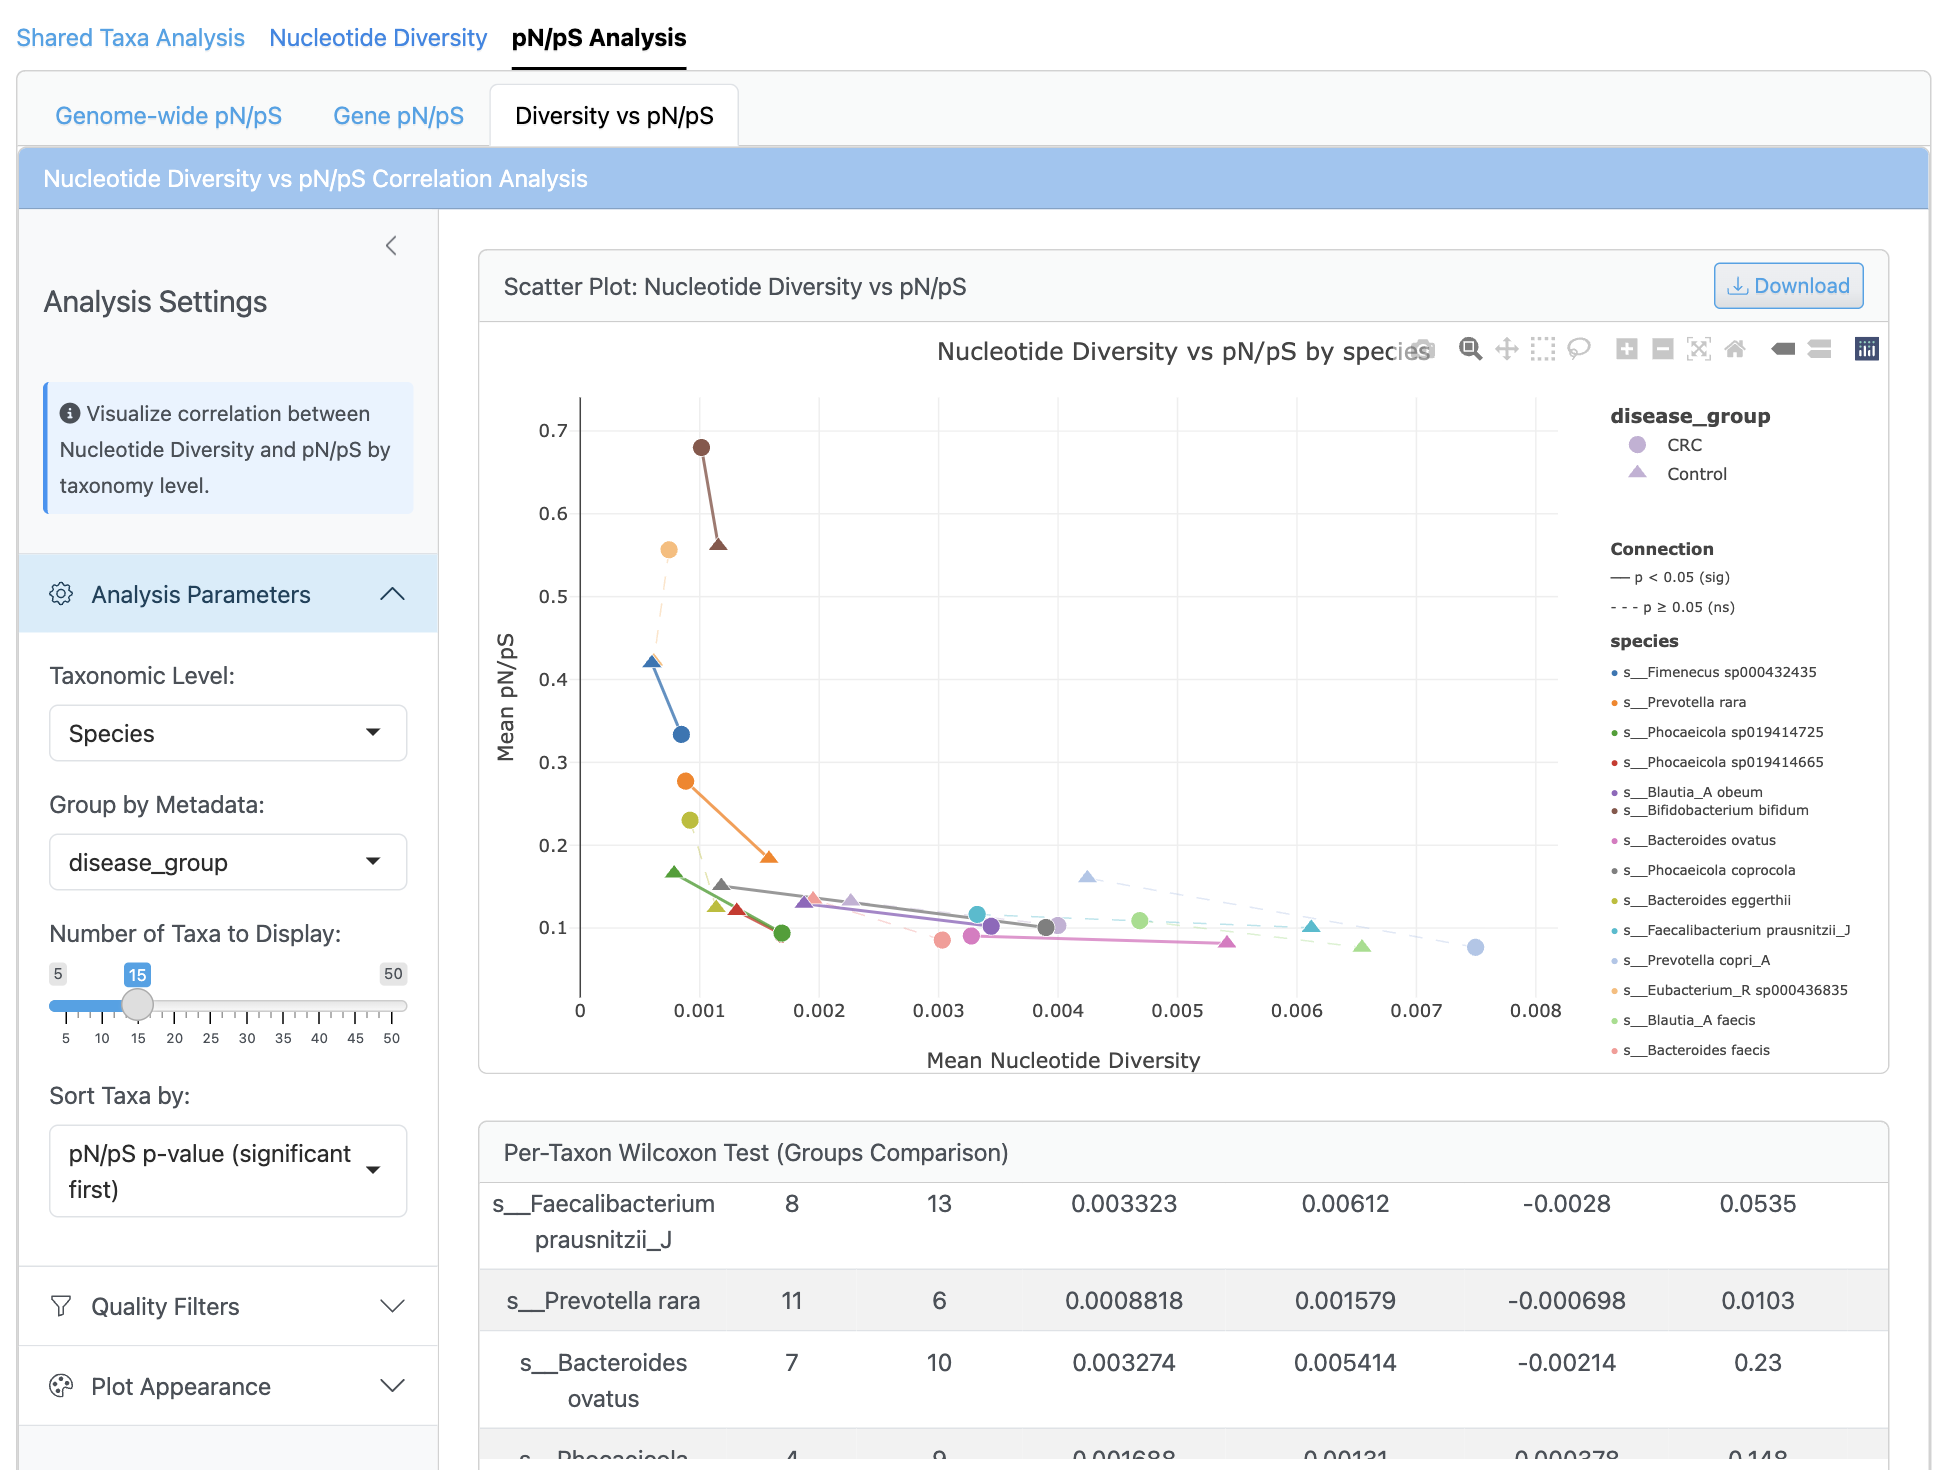
The correlation analysis displays scatterplots of nucleotide diversity versus pN/pS ratios with regression lines and confidence intervals. Per-genome and per-sample correlations are calculated using Pearson and Spearman methods, with group-specific analysis and multiple testing correction. This integrated view reveals relationships between population diversity and selection pressure across different conditions.
Usage Workflow#
A typical analysis workflow in the INTERACTIVE_STRAIN module includes:
Load your InStrain data using the Data Input panel
Use Shared Taxa Analysis to understand genome distribution
Explore nucleotide diversity patterns across samples and groups
Analyze selection pressure using pN/pS ratios
Investigate diversity-selection relationships
Export results as publication-ready figures and tables
Tips for optimal performance
For large datasets, filter to genomes of interest to improve responsiveness
Use coverage thresholds to focus on high-confidence data
Consider biological relevance when interpreting pN/pS values
Export both visualizations and raw data for comprehensive documentation
Interpreting strain-level results
When analyzing strain-level data, consider:
Coverage effects: Low-coverage genomes may have unreliable diversity estimates
Sample size: Statistical comparisons require adequate samples per group
Biological context: pN/pS interpretation depends on generation time and population size
Multiple genomes: Be cautious of multiple testing when analyzing many genomes
Usage Notes#
The INTERACTIVE_STRAIN module works with InStrain output from the WMS_STRAIN module.
For optimal performance with large datasets (>50 samples, >100 genomes), consider increasing CPU allocation.
The interface automatically detects available genomes and metadata variables.
Keep the terminal running while using the web interface; closing it will terminate the server.
GTDB metadata enhances analysis by providing taxonomic context for genomes.
Nucleotide diversity and pN/pS calculations require sufficient coverage (typically >5x).
Technical Implementation#
The INTERACTIVE_STRAIN module is built using the Shiny framework and implements a modular architecture:
Core Components:
app.R: Main application file defining the UI structure and server logic
helper/plot_customization.R: Shared functions for plot styling
helper/error_handlers.R: Error handling and user feedback
Analytical Modules:
shared_taxa_module.R: Venn diagrams and UpSet plots for taxa sharing
nucleotide_diversity_module.R: Diversity analysis and visualization
pnps_module_quick.R: Genome-wide pN/pS analysis
gene_level_pnps_module.R: Gene-level selection analysis
diversity_pnps_correlation_module.R: Integrated correlation analysis
Each module is designed as a self-contained component with its own UI and server logic, allowing for independent development and maintenance while ensuring consistent data handling across the application.
Next Steps#
After exploring strain-level data in the INTERACTIVE_STRAIN module, you can:
Complement with taxonomic analysis using the WMS_TAXONOMY module
Explore functional potential with the WMS_FUNCTION module
Investigate microbial interactions using the INTERACTIVE_NETWORK module
Export processed data for custom analyses in R or Python
The INTERACTIVE_STRAIN module provides comprehensive strain-level analysis, enabling researchers to understand microdiversity patterns, selection pressures, and evolutionary dynamics within microbial communities.