COMPARATIVE_ANNOTATION#
 This module is a part of metaFun pipeline, designed for comparative genomic analysis and functional annotation of metagenome-assembled genomes (MAGs).
Overview#
The COMPARATIVE_ANNOTATION module provides comprehensive analysis of genome functions and comparison across different samples or conditions. It performs pangenome analysis, functional annotation of genes, and generates visualizations for comparative genomics. The module identifies core, accessory, and unique genes, and annotates them with various functional databases including KEGG, VFDB, CARD, CAZymes, and eggNOG.
A key output of this module is the integrated sequence database (HDF5 format), which serves as the foundation for interactive exploration in the INTERACTIVE_COMPARATIVE module. This database links all annotations, gene sequences, and metadata, enabling powerful on-demand analyses and visualization.
Module Execution#
# Basic usage with only annotation (recommended)
(metafun) metafun -module COMPARATIVE_ANNOTATION -i genomes/ -m metadata.csv --samplecol 1

# Include metabolic pathway analysis with visualization (If you want to generate static plots.)
(metafun) metafun -module COMPARATIVE_ANNOTATION -i genomes/ -m metadata.csv --samplecol 1 --metacol 2

# Customize parameters for specific analysis
(metafun) metafun -module COMPARATIVE_ANNOTATION -i genomes/ -m metadata.csv --samplecol 1 --pan_identity 0.8 --pan_coverage 0.8
Recommended workflow
For better performance and flexibility, it is recommended to use a two-step approach:
First run COMPARATIVE_ANNOTATION with just annotation (only specify –samplecol, not –metacol)
Then explore the results interactively using
metafun -module INTERACTIVE_COMPARATIVE -i results/path
This approach avoids generating large numbers of static plots that may not be useful and interactive module allows more dynamic exploration of your data.
Module Operation Sequence#
This module performs the following steps:
Genome preparation: Processing input genomes and metadata
Gene prediction: Using Prokka to predict genes in each genome
Pangenome analysis: Using PPanGGOLiN to identify core and accessory genes
Functional annotation:
KEGG Orthology annotation with KofamScan
Virulence factor detection using VFDB
Antibiotic resistance gene identification using CARD
Carbohydrate-active enzyme annotation with dbCAN
Protein function prediction using eggNOG-mapper
Comparative analysis:
Genome similarity calculation using skani
Genome dereplication using dRep
Gene presence/absence clustering and visualization
Sequence database creation: Building an integrated HDF5 database that links all annotations, sequences, and metadata (critical for INTERACTIVE_COMPARATIVE)
Visualization: Generation of interactive plots and heatmaps for all annotations
Statistical analysis: Using Scoary2 for gene-trait associations
Parameters#
${launchDir} is the directory where you execute metaFun, and utilized as output base directory.
Parameter |
Description |
Default Value |
Note |
|---|---|---|---|
|
Input directory containing genome files |
|
Can also use genome_selector_result.csv output genomes |
|
Path to metadata file |
Required |
CSV or TSV file with sample information |
|
Column in metadata with sample identifiers |
Required |
Matches sample IDs in genome filenames |
|
Column in metadata for statistical analysis |
Optional |
If not specified, only annotation is performed |
|
Number of CPUs to use |
|
Adjust based on your system capabilities |
|
KEGG module completeness threshold |
|
Fraction of KOs needed to consider a module complete |
|
PPanGGOLiN identity threshold |
|
Sequence identity for gene clustering |
|
PPanGGOLiN coverage threshold |
|
Sequence coverage for gene clustering |
|
Kingdom for annotation |
|
Options: bacteria, archaea |
|
KEGG KO e-value threshold |
|
Threshold for KofamScan matches |
|
VFDB identity threshold |
|
Percentage identity for virulence factors |
|
VFDB coverage threshold |
|
Percentage coverage for virulence factors |
|
VFDB e-value threshold |
|
E-value threshold for virulence factors |
|
CAZyme HMM e-value threshold |
|
E-value threshold for CAZyme detection |
|
CAZyme HMM coverage threshold |
|
Coverage threshold for CAZyme detection |
|
Whether to run dRep |
|
Set to false to skip dereplication |
|
dRep ANI threshold |
|
Average nucleotide identity threshold for subspecies level dereplication |
|
dRep coverage threshold |
|
Genome coverage threshold |
|
dRep algorithm |
|
Algorithm for ANI calculation |
Inputs and Outputs#
Inputs#
Genome FASTA files (output folder from BIN_ASSESSMENT)
Metadata file (CSV or TSV format) with sample information and conditions (selected genomes metadata by GENOME_SELECTOR )
Outputs#
Annotated genes for each genome
Pangenome analysis results
Functional annotations (KEGG, VFDB, CARD, CAZymes, eggNOG)
Genome similarity matrix and dereplication results
Comparative visualizations (static and interactive)
Gene-trait associations results
Integrated sequence database (HDF5) - Critical for INTERACTIVE_COMPARATIVE module
Output directory structure#
The output is organized in a timestamped directory under ${launchDir}/results/metagenome/COMPARATIVE_ANNOTATION/:
${launchDir}/results/metagenome/COMPARATIVE_ANNOTATION/YYYYMMDDHHMMSS/
├── selected_genomes/                     # Processed input genomes
├── prokka/                               # Prokka gene predictions
│   ├── [genome1]/
│   │   ├── [genome1].ffn                 # Nucleotide sequences
│   │   ├── [genome1].faa                 # Protein sequences
│   │   ├── [genome1].gff                 # Genome annotations
│   │   └── ...
│   ├── [genome2]/
│   └── ...
├── ppanggolin_result/                    # Pangenome analysis results
│   ├── pangenome.h5                      # Pangenome database
│   ├── gene_presence_absence.Rtab        # Gene presence/absence matrix
│   ├── gene_count_matrix.tsv             # Gene count matrix
│   ├── gene_families.tsv                 # Gene family information
│   └── ...
├── annotation_results/                   # Annotation results for all tools
│   ├── kofamscan/                        # KEGG Orthology annotations
│   │   ├── ko_matrix.csv                 # KO presence/absence matrix
│   │   └── KO_definition_GeneID_countgenomes.csv # KO definitions
│   ├── VFDB/                             # Virulence factor annotations
│   │   ├── pangene_vfdb_result.txt       # Raw VFDB results
│   │   ├── gene_PA_VFDB_added.csv        # Virulence factor presence/absence
│   │   └── gene_count_VFDB_added.csv     # Virulence factor counts
│   ├── CARD/                             # Antibiotic resistance annotations
│   │   ├── pangene_rgi_CARD_result.txt   # Raw RGI results
│   │   ├── gene_PA_CARD_added.csv        # ARG presence/absence
│   │   └── gene_count_CARD_added.csv     # ARG counts
│   ├── dbCAN/                            # CAZyme annotations
│   │   ├── db_can_out/                   # Raw dbCAN results
│   │   ├── dbcan_HMMER_count_gene_PA_matrix.csv    # CAZyme presence/absence
│   │   ├── dbcan_HMMER_count_gene_count_matrix.csv # CAZyme counts
│   │   └── ...
│   ├── ani/                              # Genome similarity analysis
│   │   ├── skani_fullmatrix             # Genome similarity matrix
│   │   └── skani_ANI_dist.tsv           # ANI distance matrix
│   └── eggNOG/                           # Protein function annotations
│   │   ├── eggnog_mmseqs.emapper.annotations       # eggNOG annotations
│   │   └── ...
├── visualization_results/                # Generated plots and figures
│   ├── kofamscan/                        # KEGG visualization
│   │   ├── column_*/                     # Visualizations by metadata column
│   │   ├── KEGG_module_visualization_shiny/  # Interactive KEGG visualization
│   │   └── KEGG_module_completeness.csv  # Module completeness data
│   ├── VFDB/                             # Virulence factor visualization
│   │   ├── heatmap_VFDB_gene_PA_*.pdf    # Static VFDB heatmaps
│   │   └── VFDB_interactive_*/          # Interactive VFDB visualization
│   ├── CARD/                             # Antibiotic resistance visualization
│   │   ├── heatmap_CARD_gene_PA_*.pdf    # Static CARD heatmaps
│   │   └── CARD_interactive_*/          # Interactive CARD visualization
│   ├── dbCAN/                            # CAZyme visualization
│   │   ├── heatmap_dbCAN_gene_PA_*.pdf   # Static dbCAN heatmaps
│   │   └── dbCAN_interactive_*/         # Interactive dbCAN visualization
│   ├── defensefinder/                    # Defense system visualization
│   │   ├── heatmap_defensefinder_*.pdf   # Static defense system heatmaps
│   │   └── defensefinder_interactive_*/  # Interactive defense system visualization
│   ├── ani/                              # Genome similarity visualization
│   │   ├── column_*/                     # Visualizations by metadata column
│   │   ├── heatmap_skani.pdf             # Static skani heatmap
│   │   └── skani_interactive/           # Interactive skani visualization
│   └── scoary2/                          # Gene-trait association results
│       └── scoary_out/                   # Scoary output files
├── genePA_cluster/                       # Gene presence/absence clustering
│   └── pcoa_plot_interactive.html        # PCoA plot of gene presence/absence
├── drep/                                 # Genome dereplication results
│   ├── drep_output/                      # dRep output files
│   ├── dereplicated_genomes/            # Dereplicated genome files
│   └── subspecies_clusters.tsv          # Subspecies cluster information
└── sequence_db/                          # Sequence database
    └── sequences.h5                      # HDF5 database of sequences
Execution Examples and Results#
metaFun command line execution example#
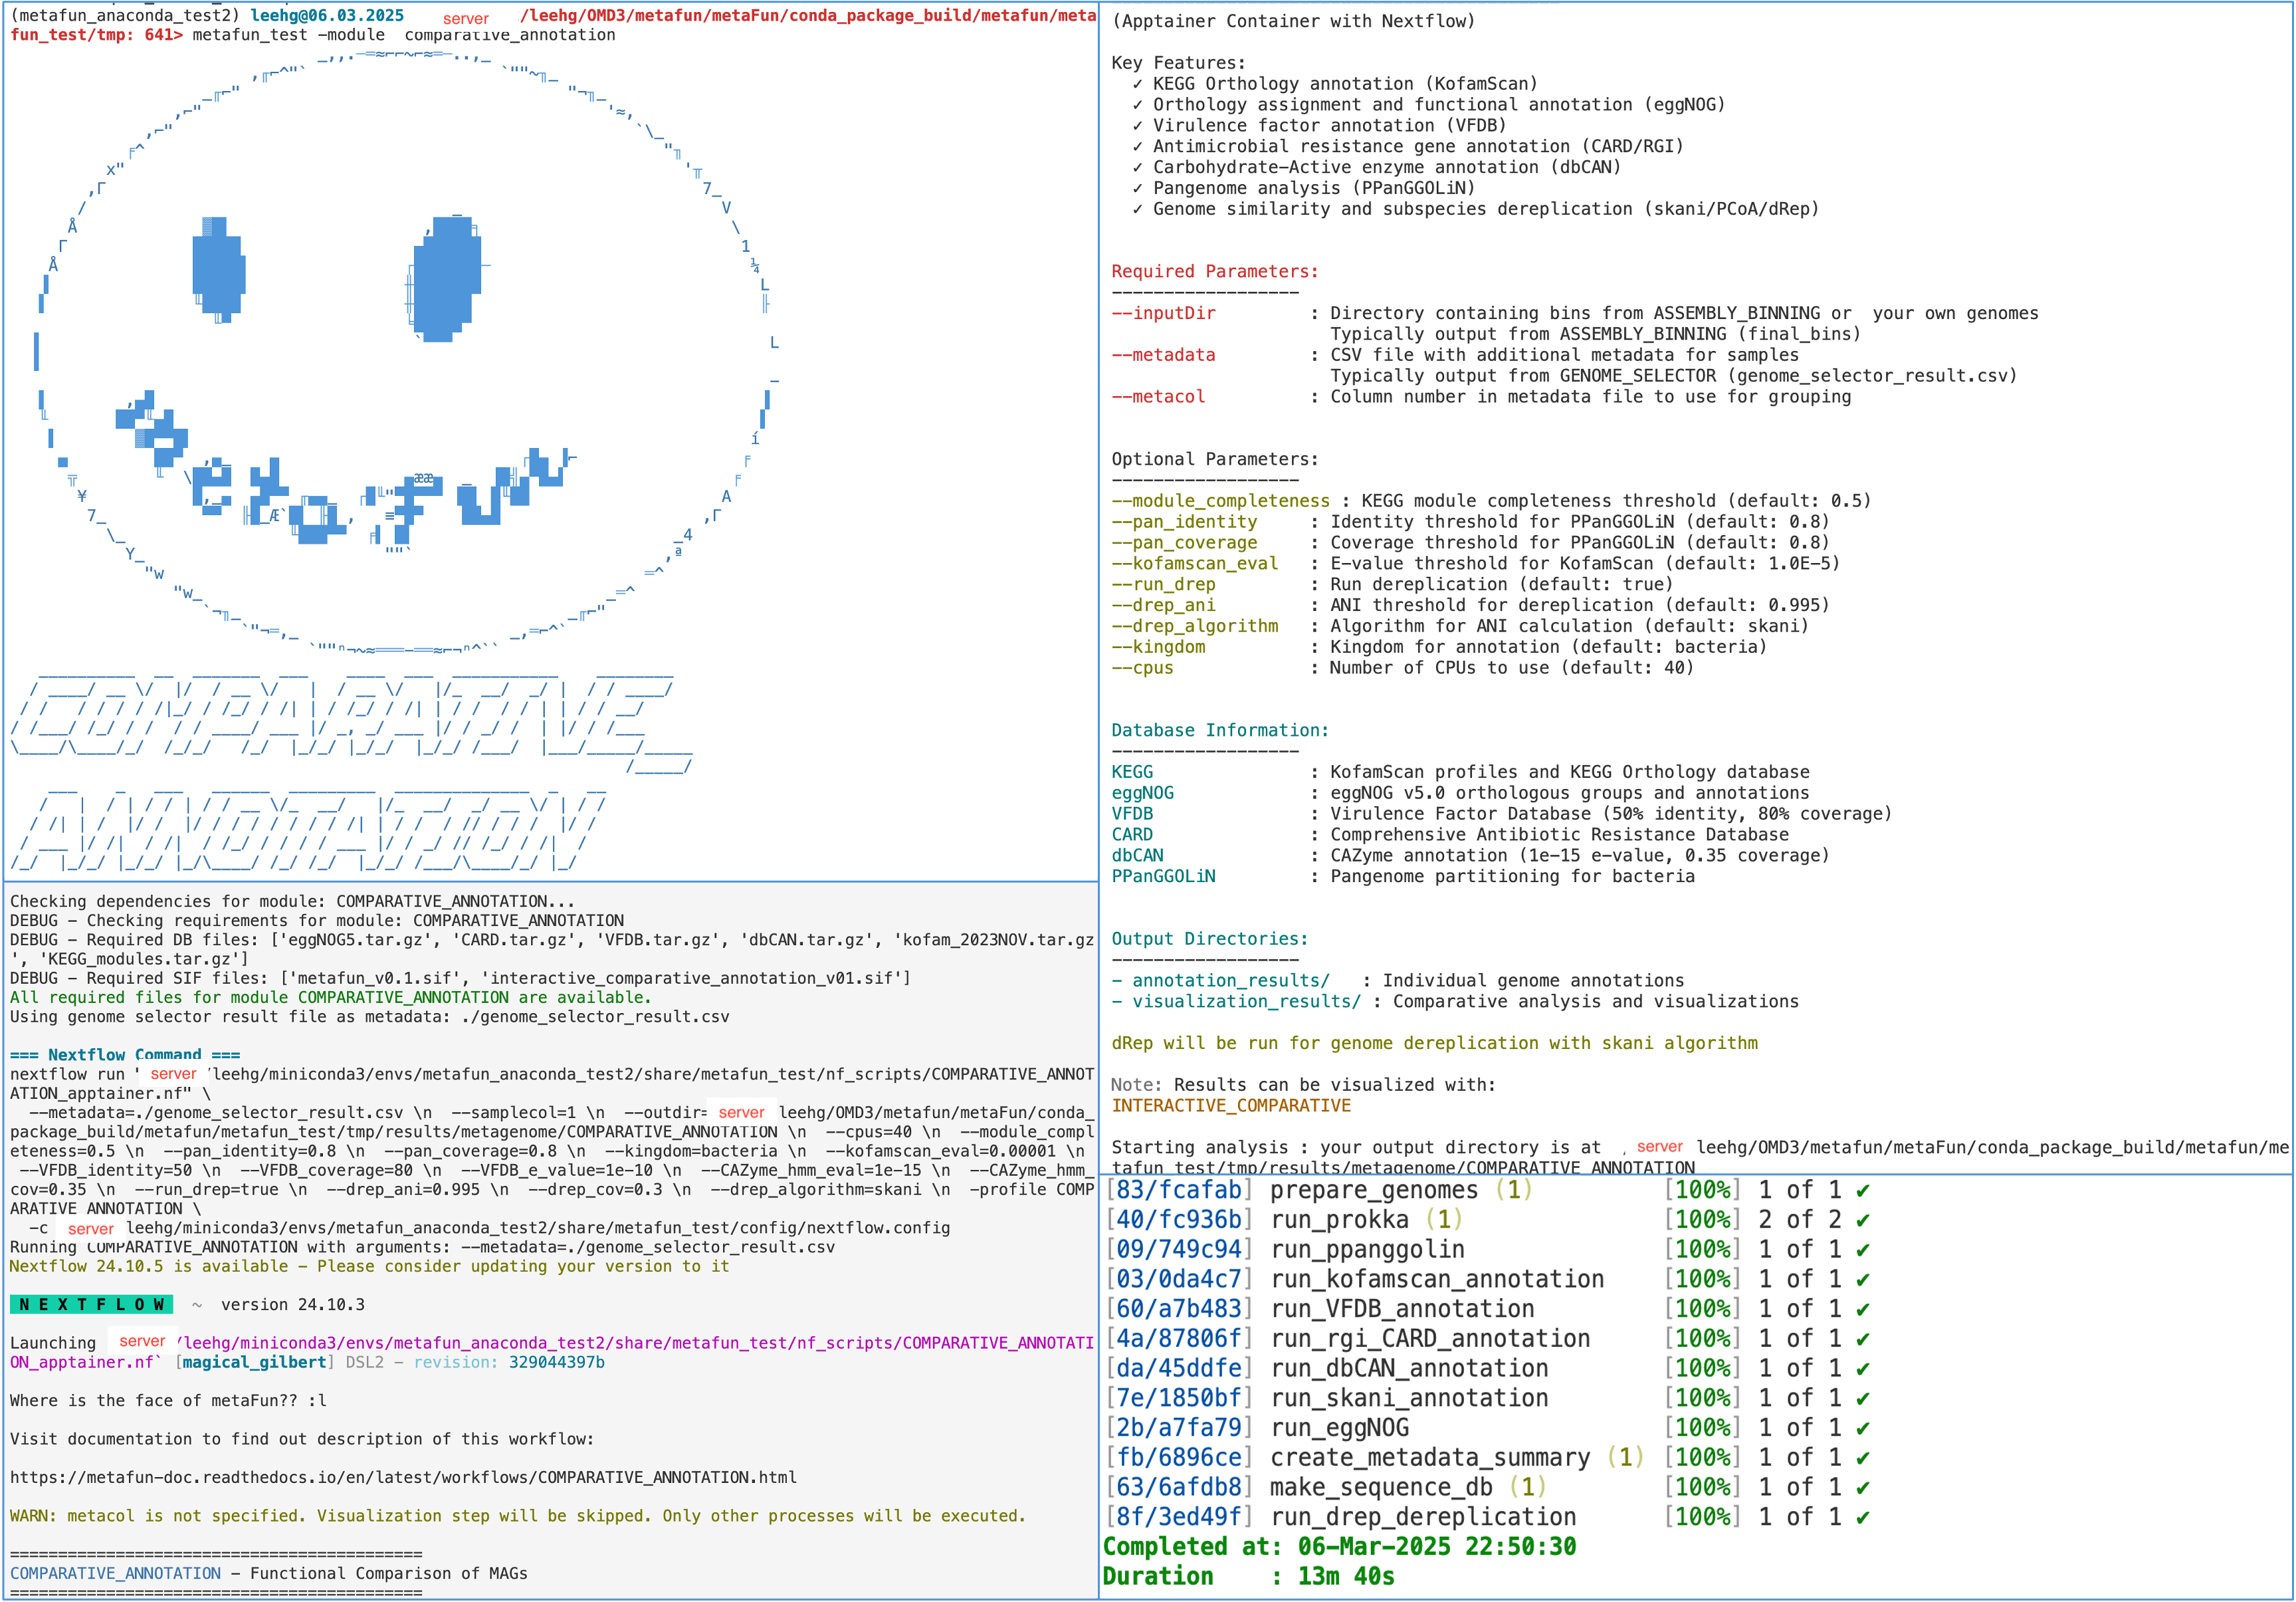
Interactive visualization of results
After running COMPARATIVE_ANNOTATION, you can explore the results interactively using:
metafun -module INTERACTIVE_COMPARATIVE -i ${launchDir}/results/metagenome/COMPARATIVE_ANNOTATION/YYYYMMDDHHMMSS
This launches an interactive interface for exploring annotations, comparing genomes, and generating custom visualizations.
Example visualizations#
The module generates various visualizations including:
PCA plots of functional profiles
Heatmaps of gene presence/absence
Hierarchical clustering of genomes
Functional enrichment plots
Genome similarity networks
Key Processes in COMPARATIVE_ANNOTATION Module#
Process |
Purpose |
Input |
Output |
|---|---|---|---|
|
Prepares genomes for analysis |
Metadata file, input genome directory |
Selected genome files |
|
Creates metadata information |
Metadata file |
Column summary file |
|
Gene prediction |
Genome FASTA files |
Predicted genes and proteins |
|
Pangenome analysis |
Prokka output |
Core and accessory genes |
|
Alternative pangenome analysis |
Prokka output |
Pangenome results |
|
Gene presence/absence clustering |
Pangenome, metadata |
PCoA visualization |
|
KEGG annotation |
Protein sequences |
KO annotations |
|
KEGG visualization |
KO matrix, metadata |
Interactive KEGG visualizations |
|
Virulence factor annotation |
Protein sequences |
Virulence factor identification |
|
Virulence factor visualization |
VFDB results, metadata |
VFDB heatmaps and interactive plots |
|
Antibiotic resistance annotation |
Protein sequences |
Resistance gene identification |
|
Resistance gene visualization |
CARD results, metadata |
CARD heatmaps and interactive plots |
|
Defense system analysis |
Protein sequences |
Defense system identification |
|
Defense system visualization |
Defense finder results, metadata |
Defense system heatmaps |
|
CAZyme annotation |
Protein sequences |
Carbohydrate-active enzyme annotation |
|
CAZyme visualization |
dbCAN results, metadata |
CAZyme heatmaps and interactive plots |
|
Genome similarity calculation |
Genome FASTA files |
ANI similarity matrix |
|
Genome similarity visualization |
Skani matrix, metadata |
ANI heatmaps |
|
Protein function prediction |
Protein sequences |
Detailed functional annotations |
|
Gene-trait association |
Gene matrix, metadata |
Statistically significant associations |
|
Genome dereplication |
Genome FASTA files |
Dereplicated genomes and clusters |
|
Creates integrated sequence database |
Prokka outputs, pangenome data, metadata |
HDF5 database that links all annotations, sequences and metadata - CRITICAL for INTERACTIVE_COMPARATIVE module |
|
Dashboard creation |
Visualization results |
Interactive dashboard for results |
|
Report generation |
Visualization results |
Summary HTML report |
Tools Used in COMPARATIVE_ANNOTATION#
Tool |
Purpose |
Version |
Parameters |
|---|---|---|---|
Prokka |
Gene prediction |
1.14.6 |
Kingdom-specific parameters based on |
PPanGGOLiN |
Pangenome analysis |
2.0.5 |
Identity ( |
KofamScan |
KEGG annotation |
1.3.0 |
E-value threshold ( |
DIAMOND |
Sequence alignment |
0.8.36 |
Used for VFDB and other database searches |
RGI (CARD) |
Resistance gene identification |
6.0.3 |
Default parameters |
dbCAN |
CAZyme annotation |
4.1.4 |
E-value ( |
skani |
Genome similarity |
0.2.1 |
Default parameters |
dRep |
Genome dereplication |
3.5.0 |
ANI threshold ( |
eggNOG-mapper |
Protein function prediction |
2.1.12 |
Default parameters |
Scoary2 |
Gene-trait association |
0.0.15 |
Default parameters |
R packages |
Visualization and statistics |
4.3.2 |
Various R packages for visualization |
rHDF5 |
Sequence database storage |
1.24.0 |
Used for creating the integrated sequence database with metadata |
Usage Notes#
The COMPARATIVE_ANNOTATION module works best with high-quality genomes selected from the BIN_ASSESSMENT module or filtered using the GENOME_SELECTOR module.
For large datasets (>100 genomes), increasing the number of processors (
-p) can significantly reduce run time.When specifying metadata columns, use the column number (1-based index in the parameter) for
--metacoland--samplecol.The
--samplecolparameter should point to a column containing identifiers that match the prefixes of your genome filenames.If
--metacolis not specified, the module will perform annotation but skip statistical analysis and many visualizations.The module processes data in two main stages: annotation (always performed) and visualization (only if
--metacolis specified).The sequence database creation (make_sequence_db) is a critical step that enables the INTERACTIVE_COMPARATIVE module to function efficiently.
For each functional category (KEGG, VFDB, CARD, CAZymes, defense systems), both presence/absence and count matrices are analyzed.
Genome dereplication with dRep is useful to remove highly similar genomes that might bias comparative analyses.
You can customize annotation thresholds to make them more or less stringent based on your research needs.
Next Steps#
After running COMPARATIVE_ANNOTATION, you can:
Explore results interactively using the INTERACTIVE_COMPARATIVE module:
metafun -module INTERACTIVE_COMPARATIVE -i results/metagenome/COMPARATIVE_ANNOTATION/YYYYMMDDHHMMSS
The INTERACTIVE_COMPARATIVE module relies on the sequence database (sequences.h5) created by this module to provide dynamic and customizable analysis.
Perform deeper analysis of specific functions of interest:
Investigate KEGG pathways enriched in specific samples
Examine virulence factors unique to certain conditions
Analyze the distribution of antibiotic resistance genes
Study carbohydrate utilization potential across genomes
Use the annotated genomes for other analyses:
Custom scripts for specific research questions
Integration with other tools or platforms
Publication-quality figure generation
Explore the sequence database:
The HDF5 sequence database is the backbone of the INTERACTIVE_COMPARATIVE module
Contains all gene sequences, protein translations, and functional annotations in a linked format
Enables fast retrieval and comparison of genes across genomes
Supports on-demand analysis and visualization in the interactive interface
The COMPARATIVE_ANNOTATION module provides a comprehensive foundation for comparative genomic analysis, enabling researchers to gain insights into the functional potential and differences across genomes from various conditions or environments.