INTERACTIVE_COMPARATIVE#
 This module is a part of metaFun pipeline, providing an interactive web interface for the exploration and analysis of results from the COMPARATIVE_ANNOTATION module.
Overview#
The INTERACTIVE_COMPARATIVE module offers a dynamic, web-based platform for visualizing and analyzing comparative genomic data. It allows researchers to interactively explore gene presence/absence patterns, functional annotations, genome similarities, and statistical associations across different genomes. The module integrates annotation results with metadata, enabling contextualized analysis and discovery of biologically meaningful patterns. With multiple specialized visualization tools, researchers can generate publication-ready figures and perform ad-hoc analyses without additional programming.
This module leverages the integrated sequence database (HDF5 format) created by the COMPARATIVE_ANNOTATION module, providing fast access to all annotations, gene sequences, and metadata for dynamic analysis.
Module Execution#
# Basic usage with recent COMPARATIVE_ANNOTATION results
(metafun) metafun -module INTERACTIVE_COMPARATIVE -i results/metagenome/COMPARATIVE_ANNOTATION/YYYYMMDDHHMMSS/

# With additional metadata file
(metafun) metafun -module INTERACTIVE_COMPARATIVE -i results/metagenome/COMPARATIVE_ANNOTATION/YYYYMMDDHHMMSS/ -m metadata.csv

# Custom output directory and processors
(metafun) metafun -module INTERACTIVE_COMPARATIVE -i results/metagenome/COMPARATIVE_ANNOTATION/YYYYMMDDHHMMSS/ -o custom_output_dir -p 8
Recommended usage
For optimal interactive experience, it is recommended to:
Use Visual Studio Code with Remote - SSH extension to connect to the server where metaFun is running
Forward the port (default: 8050) to access the web interface from your local machine
Keep the terminal running while using the interface
Module Operation Sequence#
This module performs the following steps:
Loading and preprocessing data from COMPARATIVE_ANNOTATION results
Reading the HDF5 sequence database
Loading annotation results (KEGG, VFDB, CARD, CAZymes, etc.)
Processing gene presence/absence matrices
Integrating metadata information
Launching an interactive web server with multiple analytical tools
Heatmap visualizations
Metadata exploration interfaces
Annotation result tables
Genome similarity analysis
Statistical association testing
Gene function exploration
Sequence retrieval and alignment tools
Phylogenetic tree generation
Enabling on-demand analysis through interactive components
Dynamic filtering and selection
Statistical testing
Sequence alignment and tree building
Data export for downstream applications
Parameters#
${launchDir} is the directory where you execute metaFun, and utilized as output base directory.
Parameter |
Description |
Default Value |
Note |
|---|---|---|---|
|
Input directory with COMPARATIVE_ANNOTATION results |
Most recent results |
Path to COMPARATIVE_ANNOTATION output |
|
Additional metadata file |
Optional |
CSV file with additional metadata to integrate |
|
Output directory for exported files |
|
Where exported data will be saved |
|
Number of CPU cores to use |
|
Adjust based on your system capabilities |
Inputs and Outputs#
Inputs#
Results directory from a completed COMPARATIVE_ANNOTATION run
Optional additional metadata file in CSV format for enhanced analysis
Outputs#
Exported visualizations in various formats (PNG, PDF, HTML)
Filtered datasets and tables for further analysis
Sequence alignments and phylogenetic trees
Statistical analysis results
Output directory structure#
The output files are saved in the specified output directory (default: ${launchDir}/results/interactive_comparative):
${launchDir}/results/interactive_comparative/
├── heatmap_exports/                      # Exported heatmap visualizations
│   ├── heatmap_KEGG_[timestamp].pdf      # KEGG annotation heatmap
│   ├── heatmap_VFDB_[timestamp].pdf      # Virulence factor heatmap
│   ├── heatmap_CARD_[timestamp].pdf      # Antibiotic resistance heatmap
│   ├── heatmap_dbCAN_[timestamp].pdf     # CAZyme heatmap
│   └── heatmap_ANI_[timestamp].pdf       # Genome similarity heatmap
├── genome_pcoa/                          # PCoA analysis results
│   ├── pcoa_plot_[timestamp].pdf         # Genome PCoA plot
│   └── permanova_results_[timestamp].csv # PERMANOVA statistical results
├── association_results/                  # Gene-trait association results
│   ├── association_[trait]_[timestamp].csv  # Statistical association results
│   └── manhattan_plot_[trait]_[timestamp].pdf # Manhattan plot visualization
├── sequence_exports/                     # Exported sequence data
│   ├── gene_family_[id]_[timestamp].fasta    # FASTA files for gene families
│   ├── alignment_[id]_[timestamp].aln        # Multiple sequence alignments
│   └── alignment_[id]_[timestamp].html       # Visualized alignments
└── gene_trees/                           # Phylogenetic tree results
    ├── tree_[id]_[timestamp].nwk            # Newick format tree files
    └── tree_visualization_[id]_[timestamp].pdf # Rendered phylogenetic trees
Interface Components#
The web interface is divided into multiple tabs, each providing specialized tools for different types of analysis.
Welcome Page#
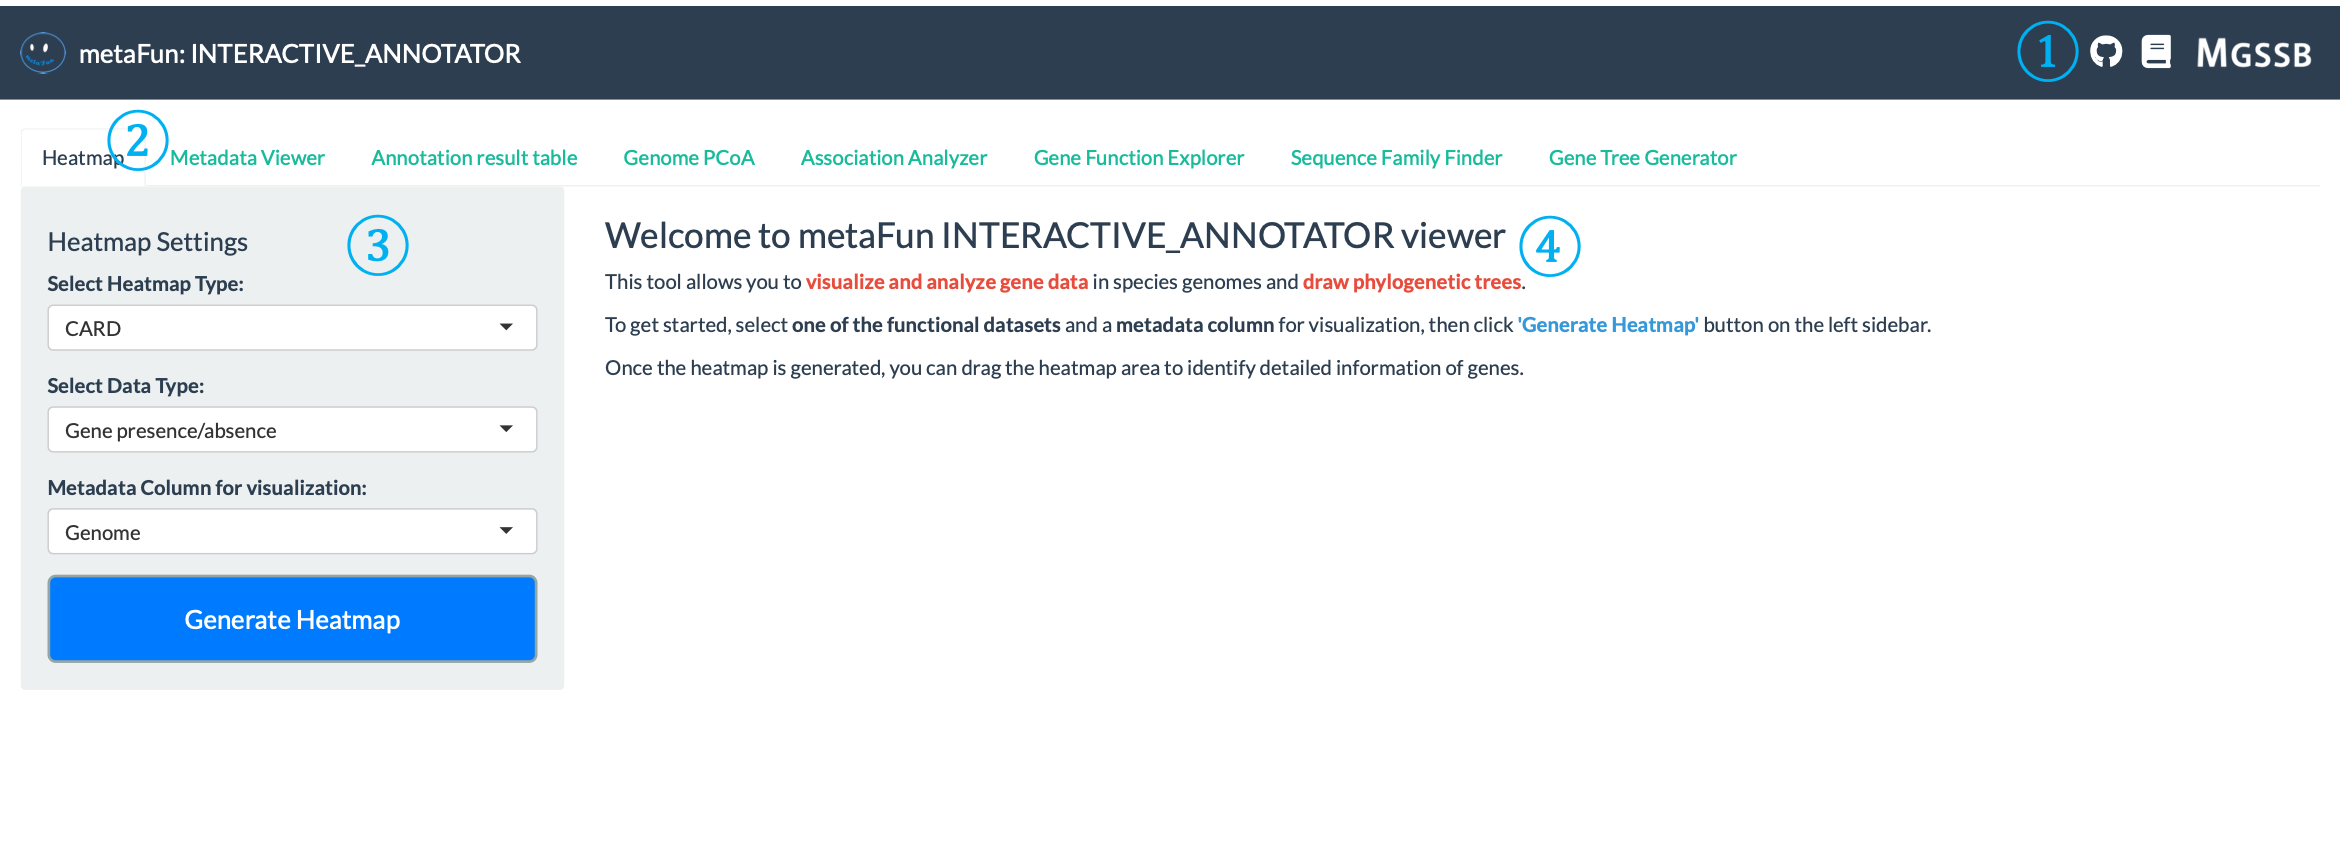
The welcome page introduces you to the INTERACTIVE_COMPARATIVE module and provides basic instructions for getting started.
① Top Navigation Links: Located at the top-right corner of the interface, providing quick access to:
GitHub repository link for source code and issues : aababc1/metaFun
Documentation link for detailed instructions : https://metafun.readthedocs.io/en/latest/
MGSSB download link for accessing additional resources and tools : https://www.microbiome.re.kr/home_design/Database.html
② Navigation Tabs: A row of tabs that provide access to different analysis tools, each specialized for specific analytical tasks:
Heatmap: Visualize gene presence/absence patterns across genomes
Metadata Viewer: Explore and analyze sample metadata distribution
Annotation Result Table: Browse detailed functional annotations using GeneIDs
Genome PCoA: Explore genome similarities in reduced dimensions
Association Analyzer: Identify statistical associations between genes and traits
Gene Function Explorer: Examine gene functions across annotation databases
Sequence Family Finder: Retrieve and analyze gene sequences
Gene Tree Generator: Build and visualize phylogenetic trees
③ Settings Panel: Control panel on the left side where you can configure visualization parameters:
Some tabs have settings panel to configure analysis and visualization parameters
④ Welcome Message and Instructions: Main content area containing:
Overview of module capabilities (visualize and analyze gene data, draw phylogenetic trees)
Step-by-step instructions for getting started
Highlighted keywords and important concepts
Tips for effective usage (selecting functional datasets, metadata columns)
Information about how to interpret results and navigate through the interface
Heatmap Tab#
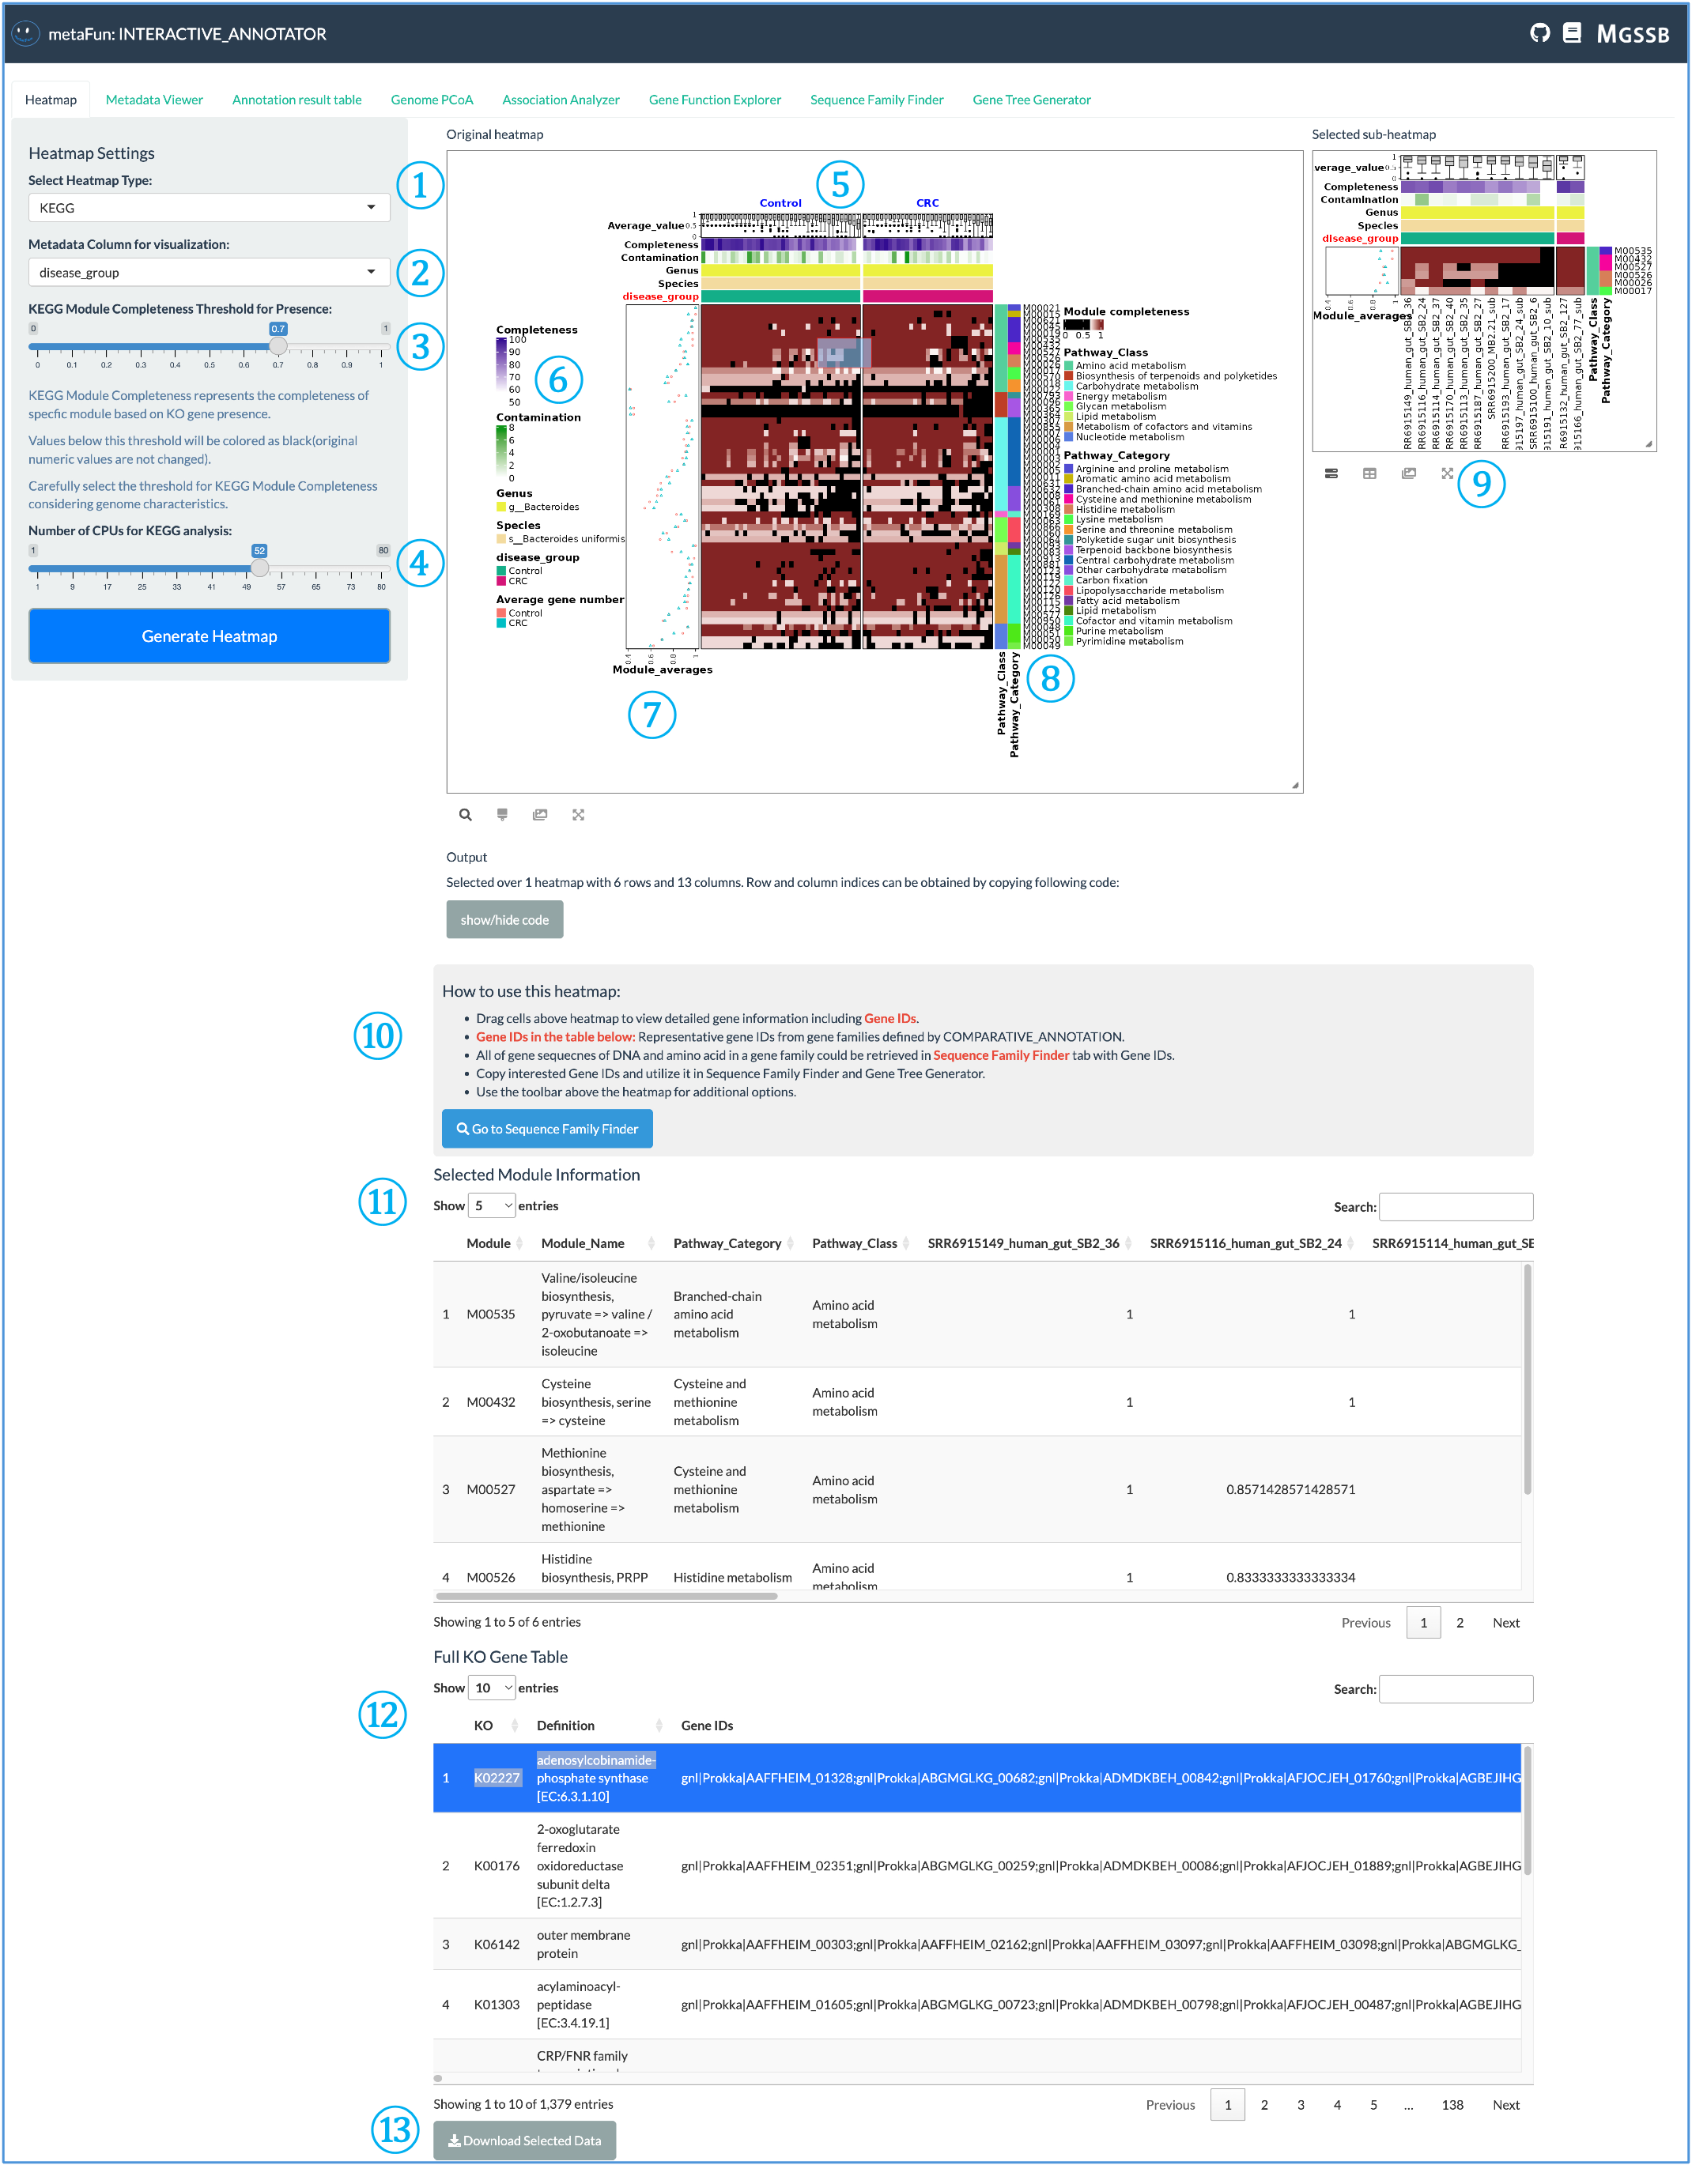
The Heatmap tab allows you to visualize gene presence/absence patterns and other annotation data across genomes.
① Heatmap Type Selector: Dropdown menu to choose which annotation database to visualize. Five different types are available:
KEGG (metabolic pathways)
VFDB (virulence factors)
CARD (antibiotic resistance)
dbCAN (carbohydrate-active enzymes)
ANI (genome similarity)
For VFDB, CARD, and dbCAN, you can generate heatmaps based on gene counts or gene presence/absence, allowing you to examine relationships with metadata.
② Metadata Column Selector: Choose which metadata variable to use for visualization. The heatmap will be split according to the selected metadata, creating distinct sections for different metadata values.
③ KEGG-Specific Settings: Unique to KEGG visualization, these settings allow you to:
Set module completeness threshold
Adjust CPU usage for computation
Utilize ggKEGG to determine the presence/absence of KEGG metabolic modules based on KO information
Black cells indicate modules that fall below the threshold (absent), while colors from white to brown indicate increasing module completeness.
④ Generate Heatmap Button: Click to create the heatmap visualization based on selected parameters. The system uses ComplexHeatmap and InteractiveComplexHeatmap R packages to generate interactive visualizations.
⑤ Heatmap Header: The top section of the heatmap displays color strips with:
Segmentation based on the selected metadata from dropdown ②
Genome completeness information
Genus and species information
Selected metadata values as color-coded strips
⑥ Color Legend: Shows the color mapping information for each element, helping you interpret the color scales used in the heatmap.
⑦ Metadata Averages: Displays the average values of the selected features or modules for each metadata category. Calculated as either:
Sum of modules / number of genomes
Sum of genes / number of genomes
⑧ Category Information: Shows the functional categories specific to the selected database, sorted by major conceptual clusters to facilitate interpretation of related functions.
⑨ Sub-Heatmap Selection: You can select a portion of the heatmap to examine a sub-heatmap of that region, allowing for detailed exploration of specific areas of interest.
⑩ Heatmap Usage Instructions: Provides basic information about the heatmap and explains how to:
Select Gene IDs from the tables below
Find corresponding sequences
Generate phylogenetic trees using the Sequence Family Finder and Gene Tree Generator tabs
⑪ Selected Module Information: Displays detailed information about the selected heatmap region, including genome information and functional annotations.
⑫ Database-Specific Table: For KEGG, this shows the full KO (KEGG Orthology) heatmap. Other databases display their respective information relevant to the selection.
⑬ Download Button: Allows you to download the data for the selected portion of the heatmap for further analysis or record-keeping.
Metadata Viewer Tab#
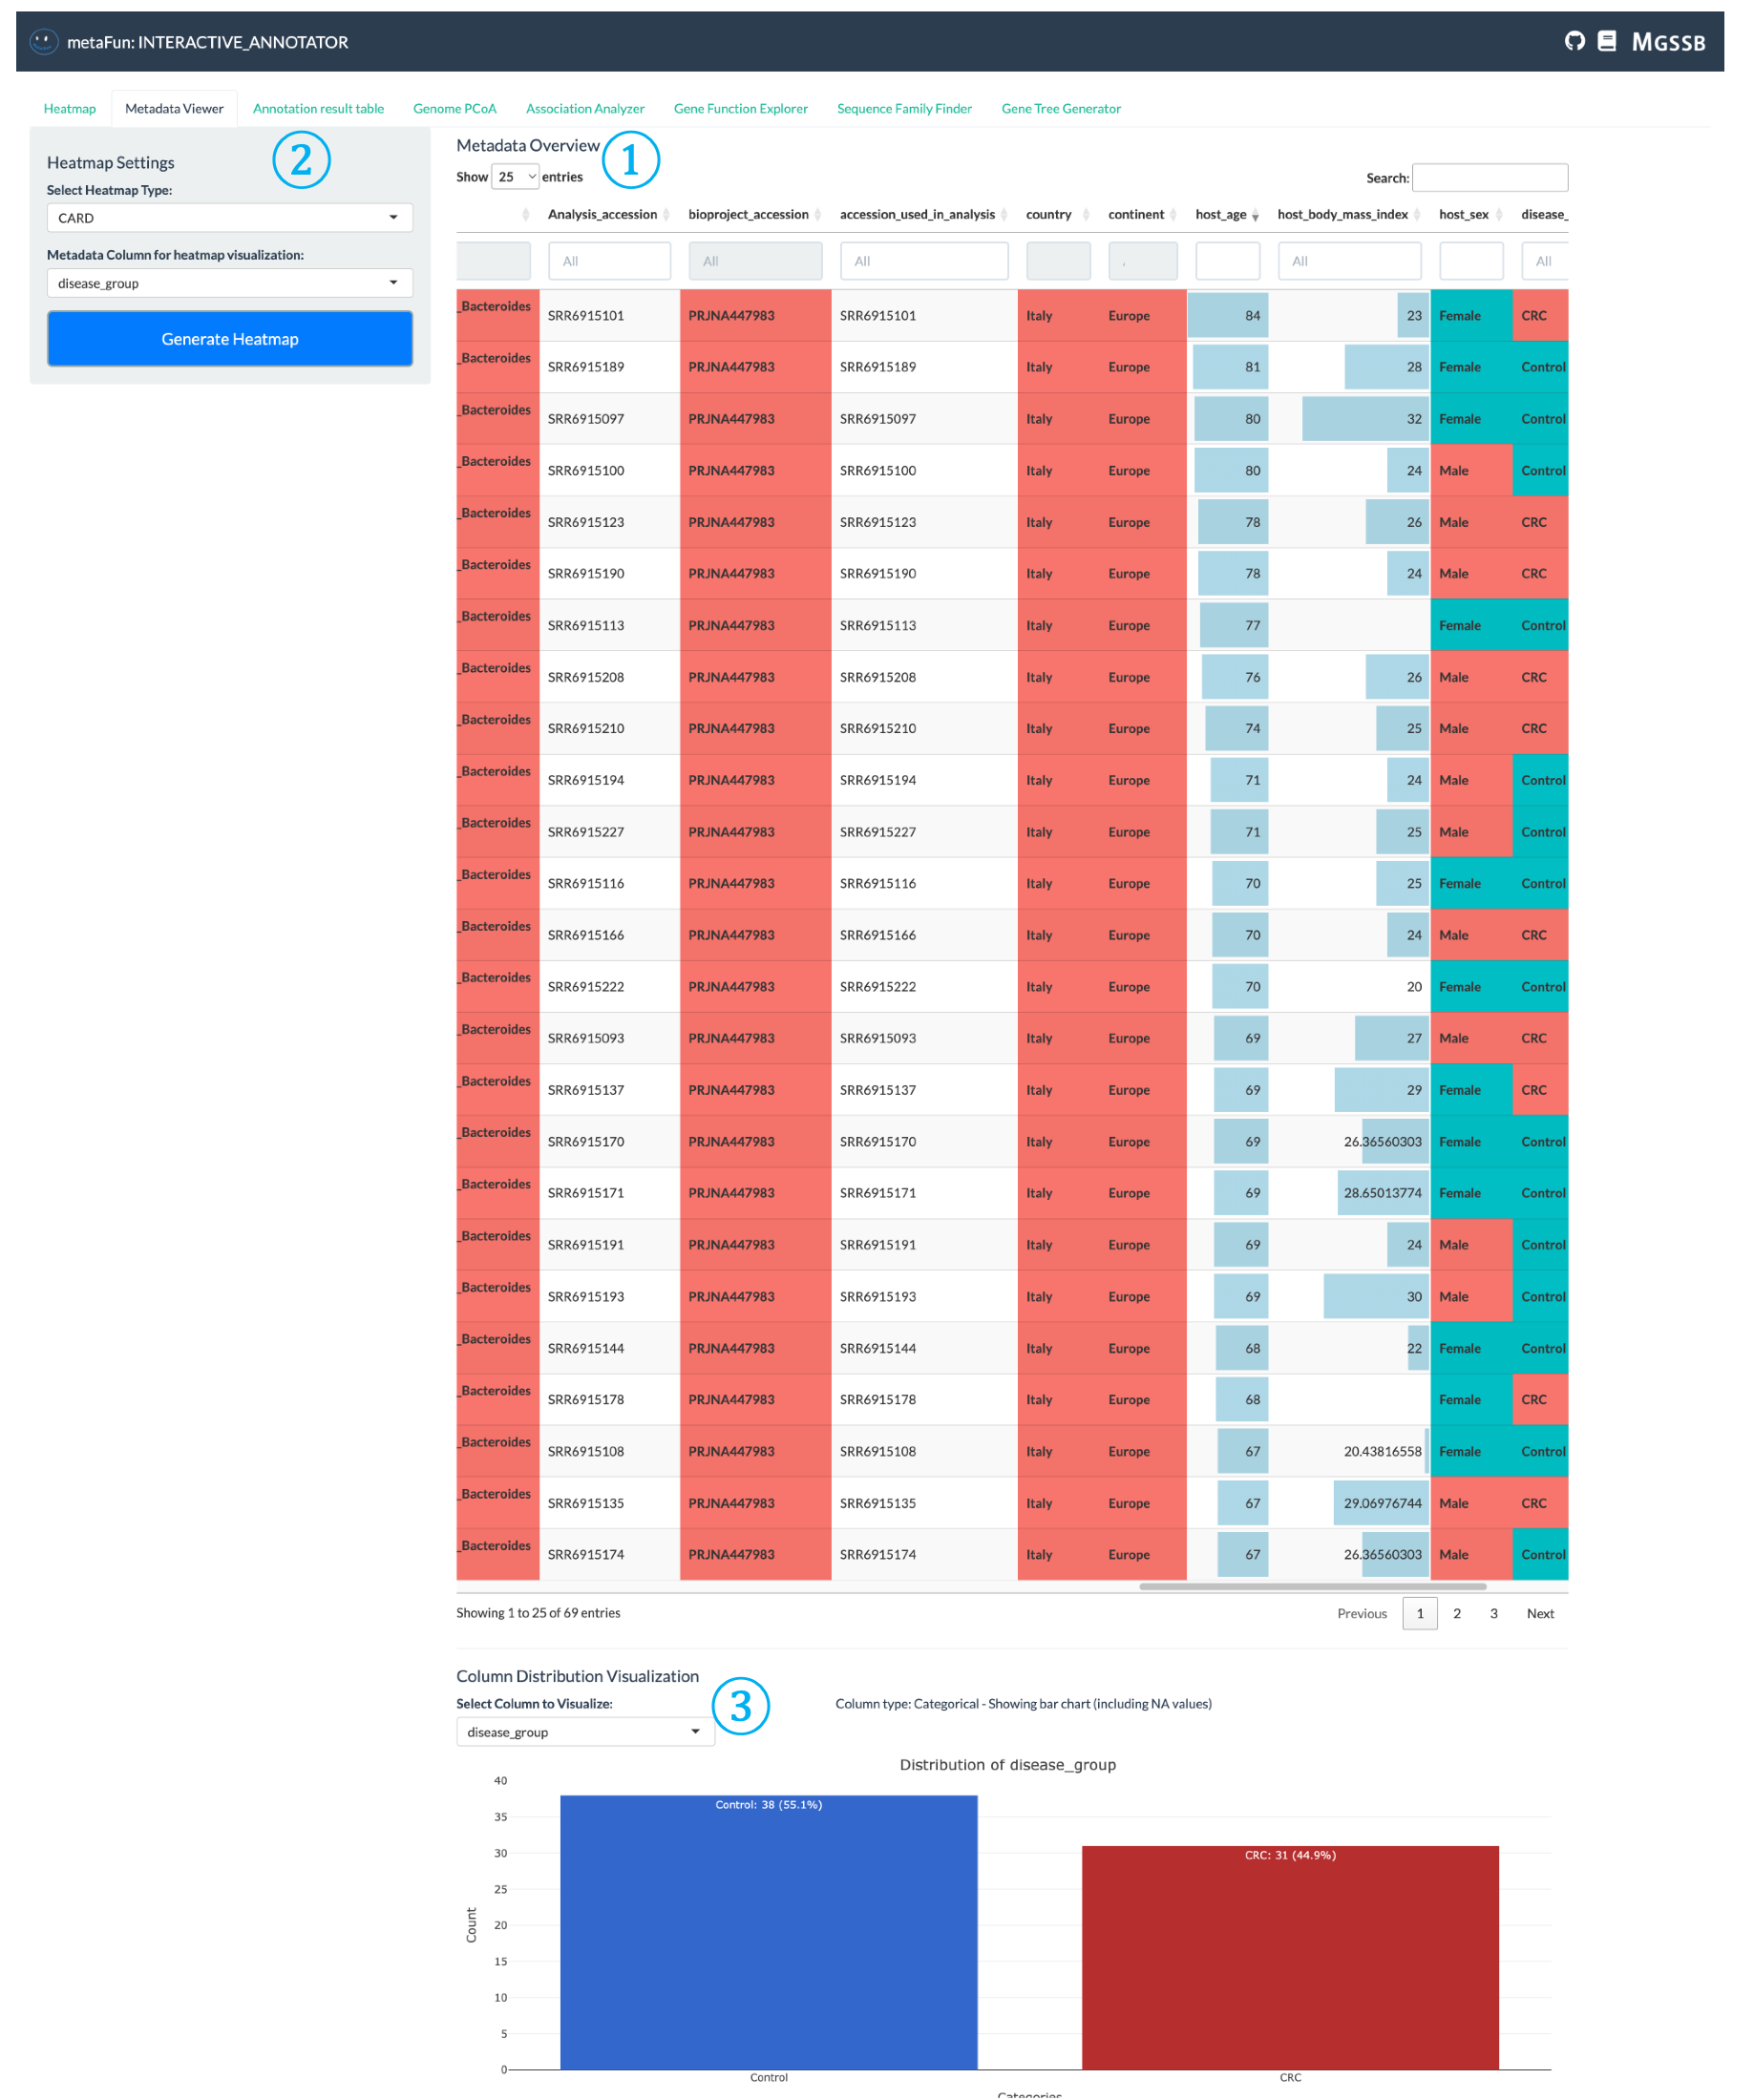
The Metadata Viewer tab helps you explore and understand the distribution of metadata across your genome dataset.
① Metadata Table Display: Interactive table showing all metadata for each genome, with different display formats based on data types:
Categorical data displayed with color-coded cells
Numerical data presented with appropriate formatting
Searchable and sortable columns for easy navigation
Color intensity reflects value ranges for better visual interpretation
② Heatmap Configuration Panel: Settings area where you can select metadata of interest for visualization in heatmaps:
Click to navigate directly to the Heatmap tab with your selected metadata
Configure how metadata will be used to organize and color genomes in heatmap visualization
Allows quick transition from metadata exploration to functional analysis
③ Distribution Visualization: Visual representation of metadata distribution across genomes:
Shows count distribution of genomes by selected metadata variables
Bar charts for categorical variables (like disease type, location)
Histograms for numerical variables
Provides statistical overview of your dataset composition
Annotation Result Table Tab#

The Annotation Result Table provides a detailed view of individual annotation results for each genome, displaying the raw results of functional annotations from various databases.
① Database Selector and Results Table: Central interface for exploring raw functional annotation data:
Select which annotation database to explore (KEGG, VFDB, CARD, CAZymes, etc.)
View comprehensive annotation information including Gene IDs, descriptions, functional categories, and scores
Search, filter, and sort results to find genes of interest
Export filtered tables in various formats for offline analysis
Genome PCoA Tab#
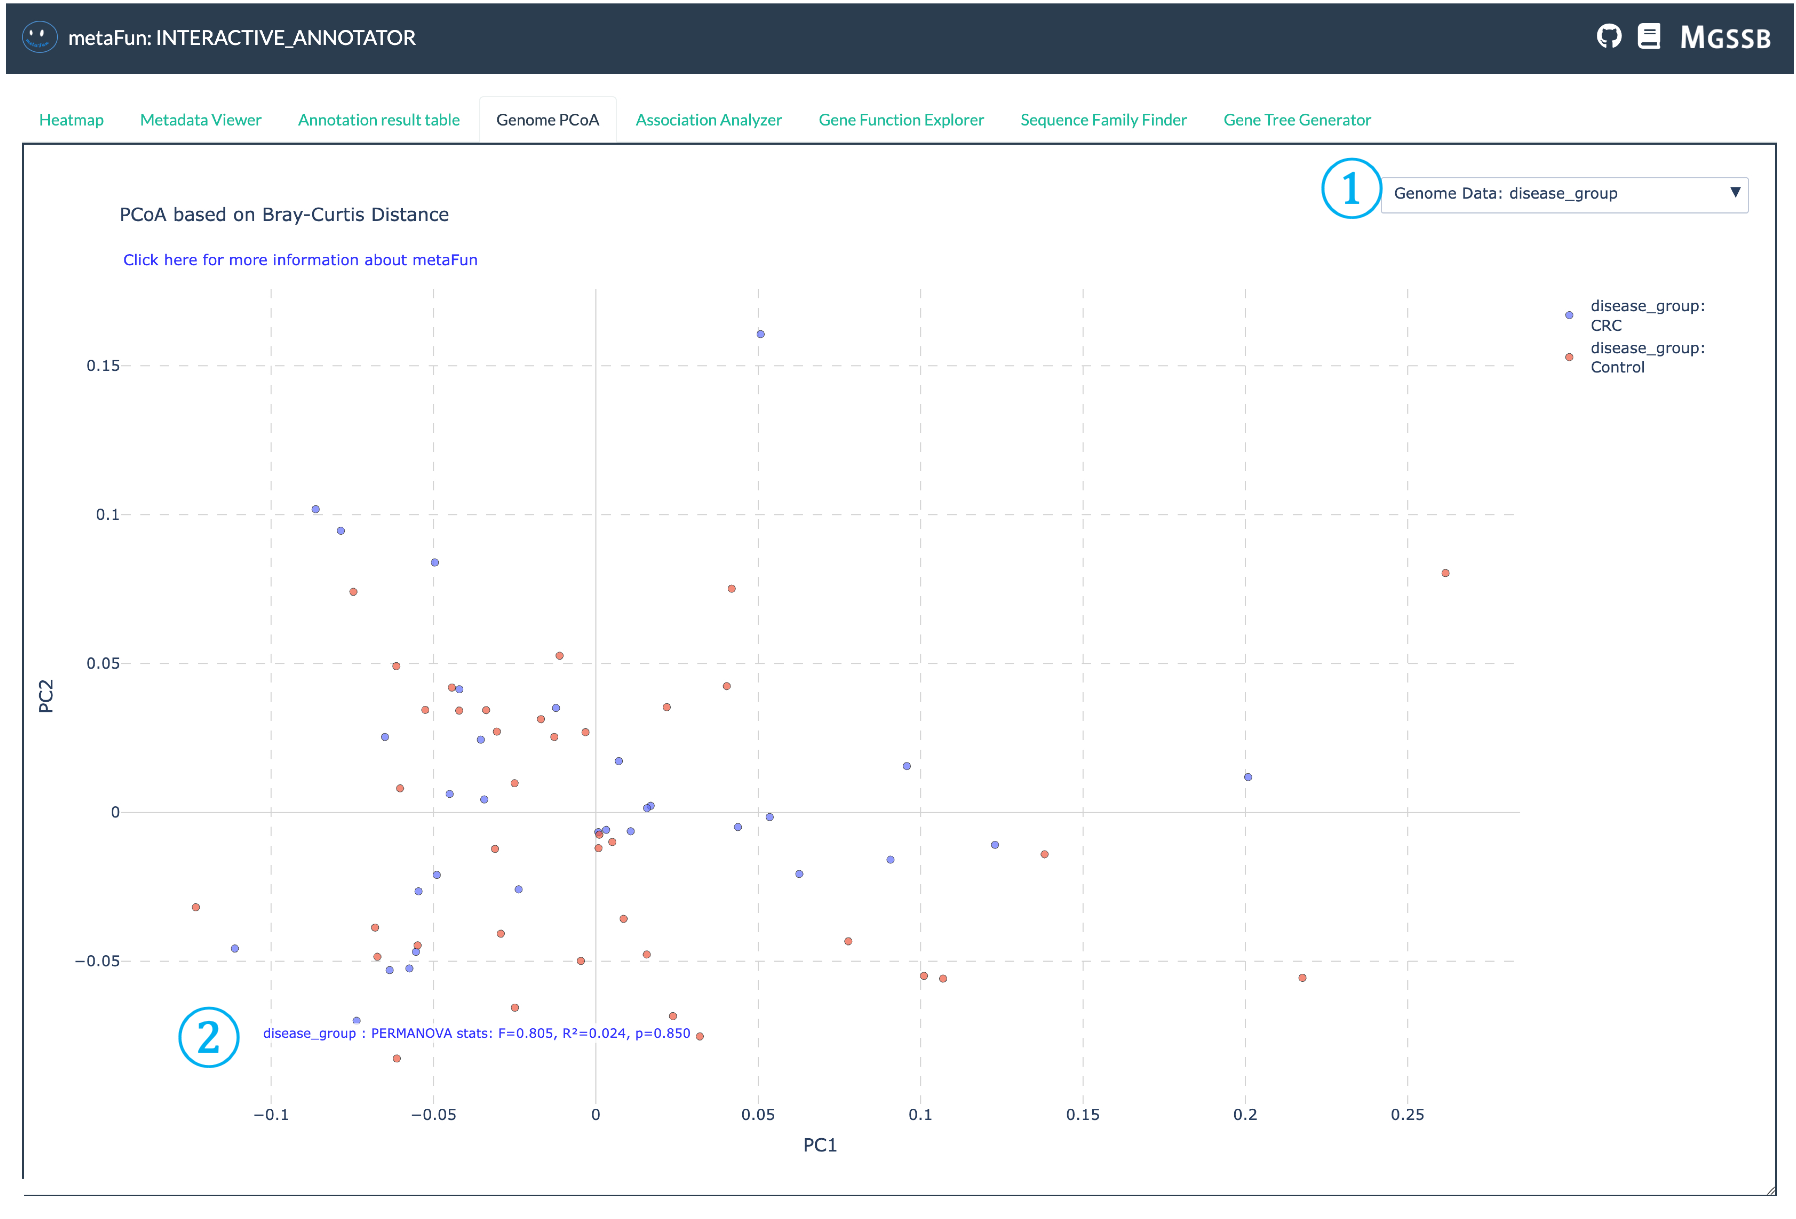
The Genome PCoA tab enables visualization of genome clustering based on gene presence/absence patterns. This analysis uses Bray-Curtis distance and Principal Coordinate Analysis (PCoA) to reduce the dimensionality of gene presence/absence data, allowing intuitive visualization of genome similarities in a two-dimensional space.
① Metadata Variable Selector: Dropdown to select which metadata variable to use for coloring and analyzing the PCoA plot. This allows you to visualize how genome similarities correlate with different metadata attributes such as disease type, location, or host information.
② PERMANOVA Statistics Result: Displays the statistical results from PERMANOVA (Permutational Multivariate Analysis of Variance) testing, showing:
R² value indicating how much variance is explained by the selected metadata variable
p-value showing statistical significance of the association
F-statistic for the permutation test
These statistics help determine if the observed clustering is statistically meaningful
Technical Details
The PCoA analysis implemented in this module uses the scikit-bio library with Bray-Curtis distance by default and performs PERMANOVA with 999 permutations to test whether the observed clustering by metadata is statistically significant. Results are displayed using Plotly’s interactive graphing capabilities, allowing for dynamic exploration of genomic similarities across different metadata categories.
Association Analyzer Tab#
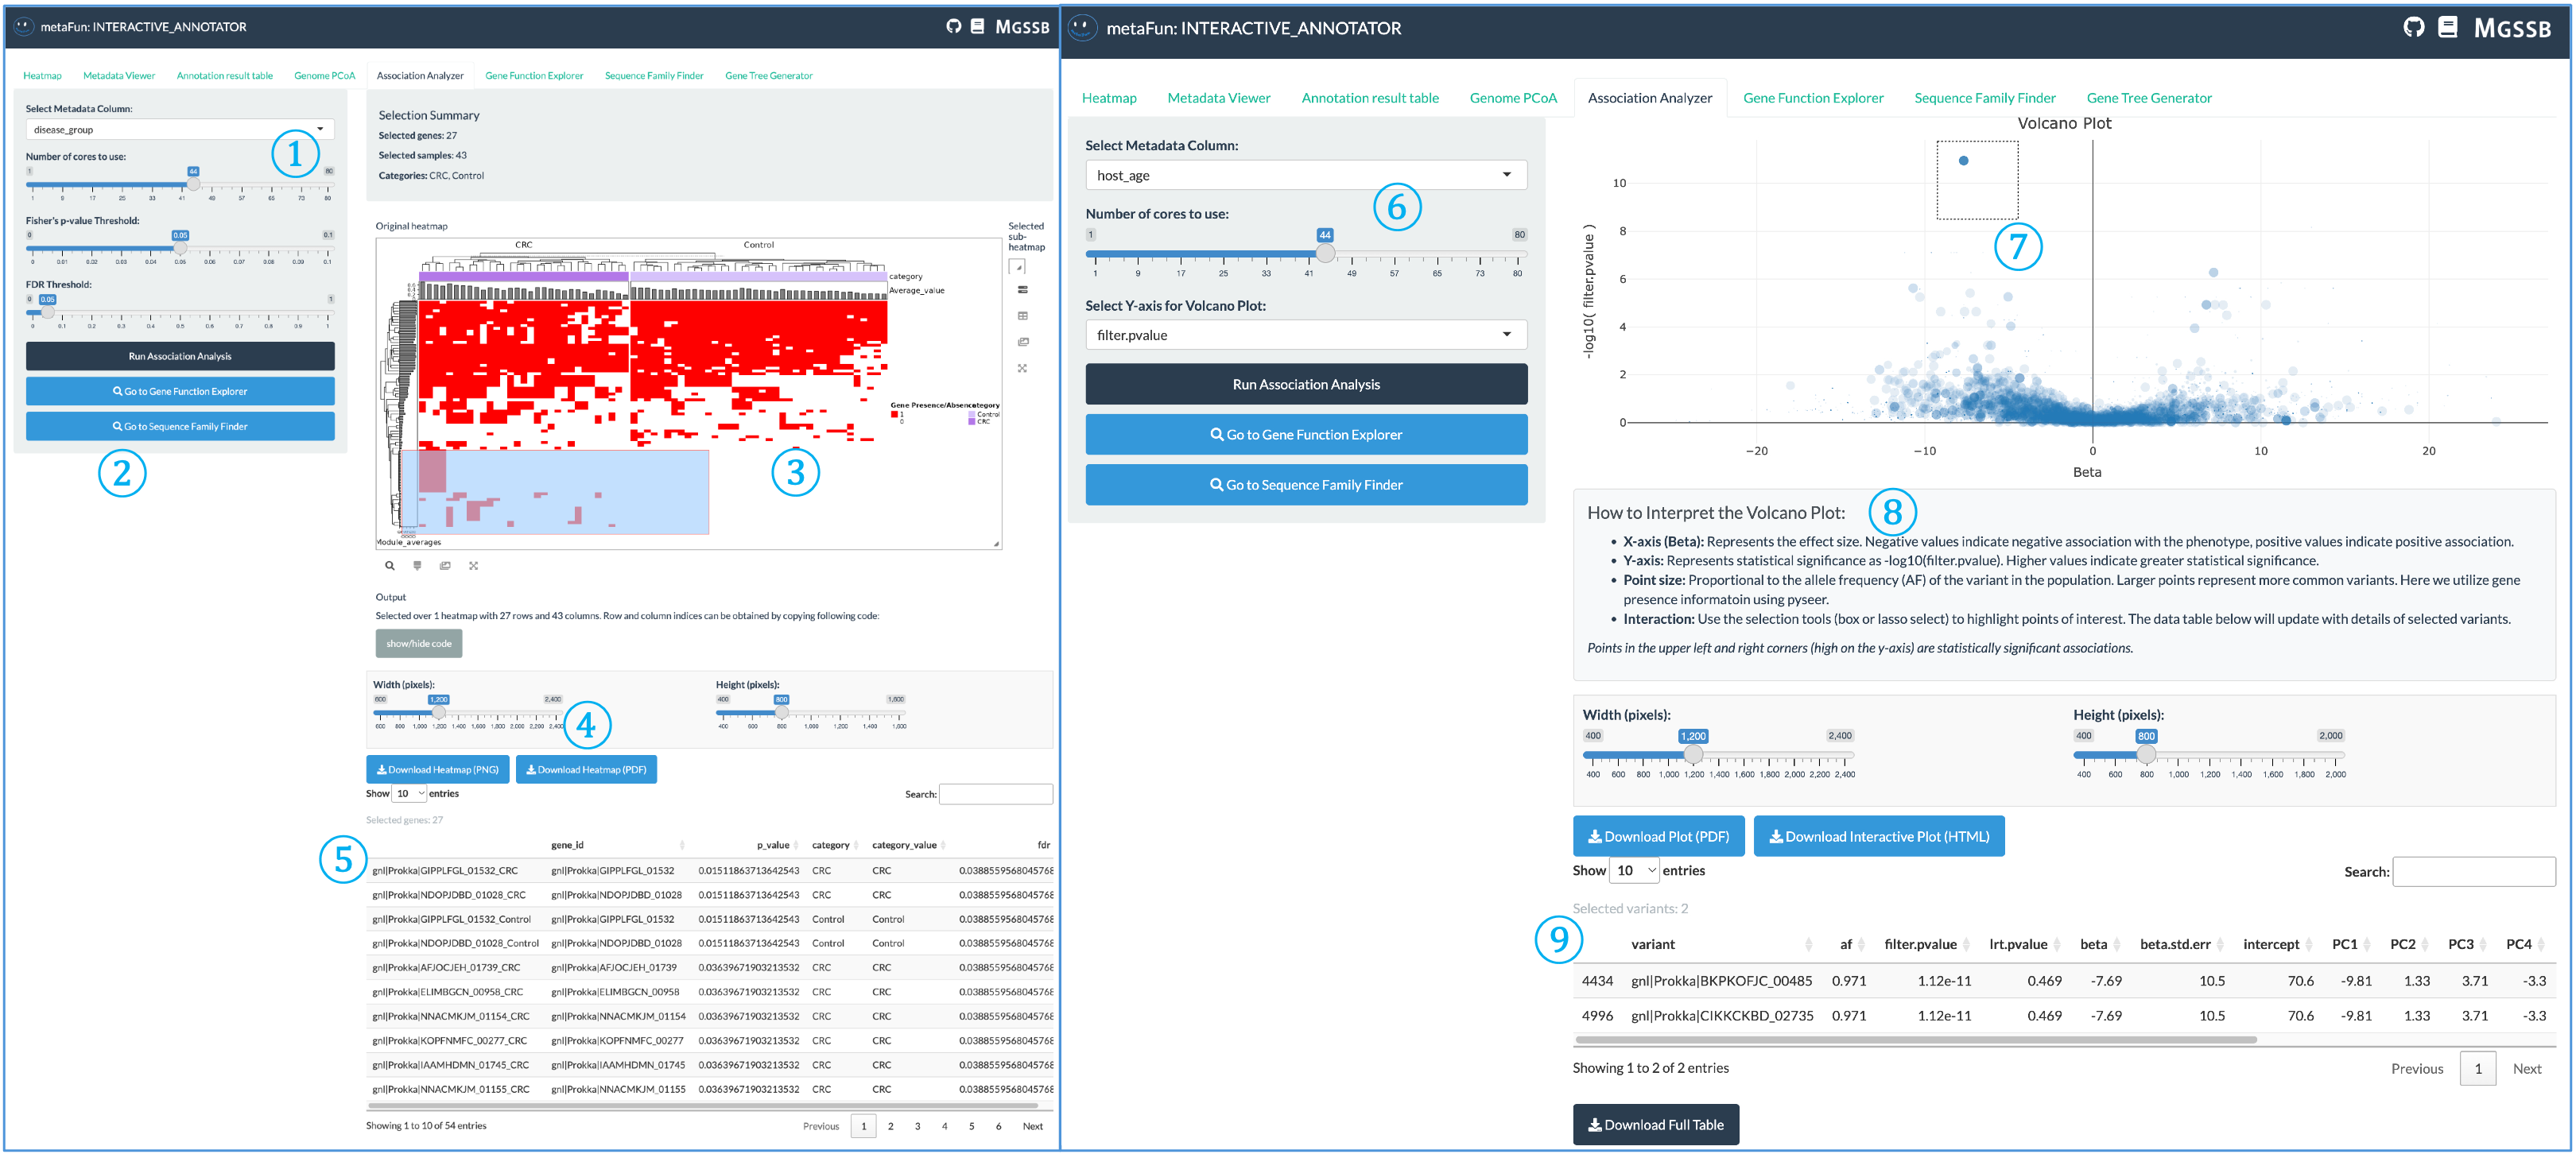
The Association Analyzer identifies statistical associations between gene presence/absence patterns and metadata variables, helping researchers discover genes potentially linked to specific traits or conditions.
① Analysis Type and Parameters: Configure your association analysis settings:
For categorical variables: Fisher’s exact test with FDR correction, showing only gene patterns above the significance threshold
Set significance thresholds and multiple testing correction methods
Population structure correction options to account for phylogenetic relationships for only numerical variables using ANI distance matrix
② Analysis Control and Navigation Panel: Central controls for executing analysis and exploring results:
Run Association Analysis button to perform statistical testing with selected parameters
View results in the table below
Navigate directly to Gene Function Explorer or Sequence Family Finder to examine significant genes
You can also create phylogenetic trees for genes of interest in Gene Tree Generator tab
③ Interactive Heatmap for Categorical Variables: Visualization of association results for categorical variables:
Genes and metadata variables arranged in matrix format
Color intensity representing association strength
Click on cells to display detailed gene information and statistical values
Hierarchical clustering of related genes and metadata categories
④ Download Panel: Controls for exporting visualizations:
Adjust width and height of output figures
Download as PNG or PDF formats for publication
Customize image resolution and appearance
⑤ Selected Gene Table: Detailed information about genes selected from the heatmap (item ③):
Gene identifiers and annotations
Statistical values and significance
Presence/absence patterns across genomes
Functional categories and descriptions
⑥ Numerical Variable Analysis Panel: Analysis controls for continuous metadata variables:
Uses pyseer in the background with gene presence/absence data
Corrects for population structure using ANI distance matrix
Adjustable CPU usage for faster analysis
Displays corrected associations between genes and continuous traits
⑦ Volcano Plot: Interactive visualization of significance vs. effect size:
X-axis displays beta values (effect size/direction)
Y-axis shows statistical significance (-log10 of p-value)
Toggle between filter-pvalue (unadjusted for population structure) and lrt-pvalue (population structure corrected)
Points represent individual genes, with significant associations appearing in the upper regions
⑧ Statistical Interpretation Guide: Explanation of the volcano plot and statistical values:
How to interpret effect size direction (negative/positive associations)
Significance thresholds and their meaning
Point size representing gene frequency in the population
Tips for identifying statistically significant associations
⑨ Selected Gene Details Table: Comprehensive information about genes selected from the volcano plot:
Gene variant identifiers
Statistical measures (p-values, beta coefficients)
Effect sizes and directionality
Sample counts and distribution across metadata categories
Understanding p-values in pyseer analysis
The Association Analyzer uses two key p-values from pyseer for numerical variable analysis:
filter-pvalue: Association of the variant with the phenotype, unadjusted for population structure. This value shows the raw correlation without accounting for phylogenetic relationships.
lrt-pvalue: The p-value from the likelihood ratio test in the mixed model association, which accounts for population structure. This is typically more conservative and represents a more reliable assessment. minimized.
Gene Function Explorer Tab#
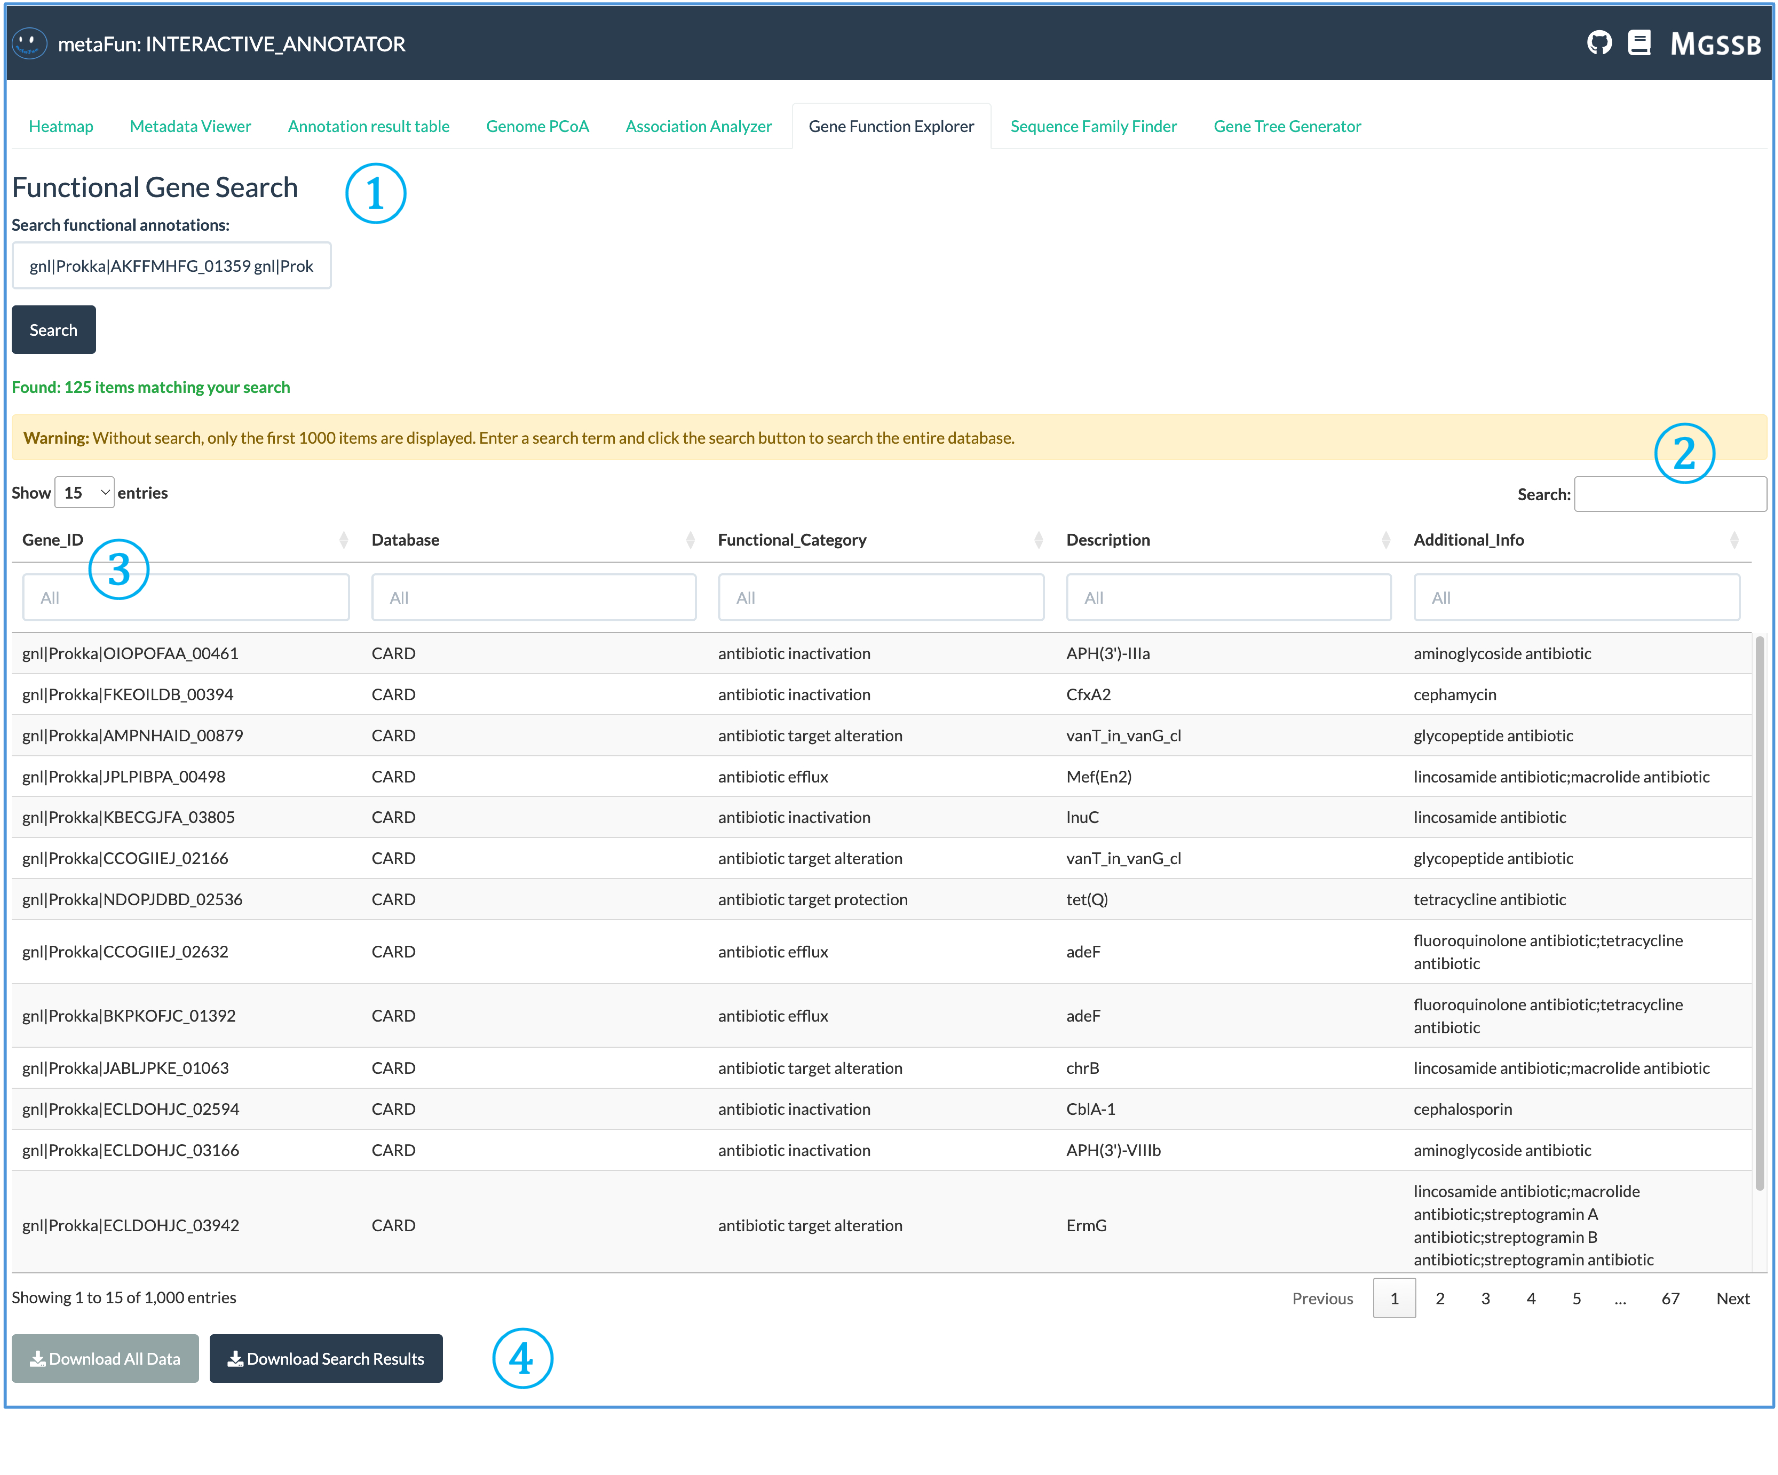
The Gene Function Explorer allows detailed exploration of gene functions across annotation databases.
① Functional Gene Search: Search interface for querying genes by their identifiers or functional annotations:
Multiple Gene IDs can be searched simultaneously using spaces or line breaks (not semicolons)
Enter full or partial gene identifiers to find matches across all databases
Search automatically finds all functional annotations associated with your query terms
② Search Results Information: Provides information about the search results:
Number of items matching your search criteria
Warning messages when results are truncated due to large result sets
Display controls for adjusting how many entries are shown at once
③ Interactive Results Table: Comprehensive table with detailed annotation information:
Before searching, the table displays the complete functional annotation database
Each column has its own search field for filtering by specific categories
Multiple entries may appear for the same gene when annotated by different databases
Database sources are intentionally kept separate to allow comparison of functional assignments
④ Data Export Options: Buttons for downloading the annotation data:
Download the complete annotation dataset for offline analysis
Export only the filtered search results based on your queries
Data provided in formats suitable for further processing
Important: Genes and functions identified in this tab can be directly used for further analysis in the Sequence Family Finder tab to retrieve their sequences, and in the Gene Tree Generator tab to create phylogenetic trees. This integration enables seamless workflow from functional discovery to evolutionary analysis.
Sequence Family Finder and Gene Tree Generator Tabs#

These two tabs work as coupled components, providing an integrated workflow from sequence retrieval to phylogenetic analysis.
① Gene Family Search Box: Input field for finding sequence families across the pangenome:
Enter representative gene IDs from the pangenome to search for related sequences
Use line breaks or semicolons as delimiters when searching multiple genes
After entering IDs, click the Search button to retrieve sequences
② Draw Phylogenetic Tree Button: Transfers the search results from Sequence Family Finder to the Gene Tree Generator tab:
Click this button after finding sequences to initiate phylogenetic analysis
Automatically passes selected sequence data to the tree-building interface
Enables seamless transition between sequence retrieval and evolutionary analysis
③ Data Export Controls: Options for saving retrieved sequence data to the server:
Set a base filename for your exported files
Save nucleotide sequences (FFN format)
Save amino acid sequences (FAA format)
Export gene metadata for reference and documentation
Files are saved on the server for further analysis or sharing
④ Sequence Family Table: Displays gene families matching your search query:
Shows all sequences within the same gene family across genomes
Includes genome identifiers and sequence information
Allows exploration of sequence conservation within gene families
Sortable and searchable for finding specific sequences
⑤ Sequence Viewer Panels: Displays retrieved sequence data in FASTA format:
Nucleotide sequences (FFN) showing DNA composition
Amino acid sequences (FAA) showing protein translations
Enables visual inspection of sequence conservation
Provides access to raw sequence data for further analysis
⑥ Sequence Metadata Table: Comprehensive information about each sequence:
Genome source and identification
Quality metrics and annotations
Taxonomic information
Functional annotations when available
⑦ Tree Building Interface: Controls for generating phylogenetic trees:
Toggle between nucleotide and amino acid-based tree construction
Multiple sequence alignment performed using MAFFT for both amino acid and nucleotide sequences with optimized thread parameters
Tree construction using FastTree with models optimized for sequence type:
Nucleotide trees: GTR model with gamma rate heterogeneity (-gtr -gamma -nt)
Protein trees: LG model with gamma rate heterogeneity (-lg -gamma)
Tree processing includes midpoint rooting (phytools::midpoint_root) for meaningful representation without requiring an outgroup
Zero-length branch handling by adding a small epsilon (1e-10) to avoid computational issues
Duplicate node label detection and resolution
Visualization with interactive controls for tree manipulation
⑧ Tree Visualization and Analysis: Interactive phylogenetic tree display:
Tree leaves colored according to selected metadata variables
Statistical analysis based on metadata type:
Categorical variables: Model fitting using fitdiscrete from the geiger package with multiple models (equal rates, symmetric, all rates different) compared using AIC values
Numerical variables: Phylogenetic signal calculation using Pagel’s lambda (phytools::phylosig) to measure the strength of correlation between trait values and phylogeny with significance testing
Both static (ggtree) and interactive (plotly) visualization options
Interactive legend showing metadata categories or value ranges
Statistical results displayed alongside the tree
⑨ Tree File Information: Details about generated tree files on the server:
Alignment file location (FASTA format)
Tree file location (Newick format)
Plot file location (PDF format)
Interactive visualization file location (HTML format)
All files saved in the output directory for later access
⑩ Tree Sequence Metadata: Table showing metadata for sequences included in the tree:
Genome information for each sequence in the tree
Quality metrics and taxonomic classification
Metadata values used for coloring the tree
Helps interpret phylogenetic relationships in context of genome metadata
The Integrated Sequence-to-Tree Workflow
The Sequence Family Finder and Gene Tree Generator tabs are designed to work together, offering a streamlined workflow:
Search for gene families of interest using gene IDs from other tabs
Review the retrieved sequences and their distribution across genomes
Click the “Draw Phylogenetic Tree” button to transfer sequences to tree building
Adjust tree parameters and select metadata for coloring
Generate and visualize the phylogenetic tree
Interpret evolutionary relationships in the context of metadata
Export trees and alignments for publication or further analysis
This integrated approach makes it easy to explore the evolutionary relationships of genes discovered through other analyses in the INTERACTIVE_COMPARATIVE module.
Usage Notes#
The INTERACTIVE_COMPARATIVE module requires results from a completed COMPARATIVE_ANNOTATION run, particularly the integrated sequence database (HDF5 format).
The web interface adapts to the available data in your COMPARATIVE_ANNOTATION results, enabling only the relevant features.
For optimal performance with large datasets (>100 genomes), consider increasing the number of processors (
-p).All visualizations can be exported as publication-ready figures in various formats.
The module works best in a Visual Studio Code with Remote - SSH environment to ensure stable connectivity to the web interface.
Keep the terminal running throughout your analysis session; closing it will terminate the web server.
Additional Metadata
You can provide additional metadata through the -m parameter to enhance your analysis. This is particularly useful for:
Including metadata that was not available during the COMPARATIVE_ANNOTATION run
Updating metadata with new information
Adding derived metrics for more complex analyses
Example Workflows#
Identifying Environment-Specific Genes#
Load COMPARATIVE_ANNOTATION results
Use the Heatmap tab to visualize gene presence/absence patterns
Color genomes by environment metadata
Identify clusters of genes specific to particular environments
Use the Association Analyzer to find statistically significant associations
Explore functions of associated genes with Gene Function Explorer
Export results for publication
Comparing Strains from Different Hosts#
Load COMPARATIVE_ANNOTATION results with host metadata
Use Genome PCoA to visualize overall strain relationships
Perform PERMANOVA test to quantify host effect on genome content
Identify host-specific genes using Association Analyzer
Retrieve sequences for genes of interest with Sequence Family Finder
Generate phylogenetic trees to understand gene evolution across hosts
Export visualizations and statistical results
Exploring Antibiotic Resistance Patterns#
Load COMPARATIVE_ANNOTATION results with antibiotic resistance metadata
Use the Heatmap tab to visualize CARD annotations
Color and cluster genomes by resistance profiles
Identify resistance gene patterns using Association Analyzer
Examine sequences of key resistance genes with Sequence Family Finder
Generate gene trees to understand the evolution of resistance genes
Export results for further analysis or publication
Next Steps#
After exploring data in the INTERACTIVE_COMPARATIVE module, you can:
Export processed datasets for custom analysis with other tools
Generate publication-quality figures directly from the interface
Identify specific genes of interest for targeted experimental validation
Develop hypotheses about functional adaptations in your genomes
Perform follow-up analyses based on discoveries made during interactive exploration
The INTERACTIVE_COMPARATIVE module serves as a powerful platform for data-driven discovery in comparative genomics, enabling researchers to extract biological insights from complex genomic data without extensive programming.
Key R Packages Used in INTERACTIVE_COMPARATIVE#
The interactive visualization and analysis capabilities of this module rely on several specialized R packages:
Phylogenetic Analysis#
ape: Core package for phylogenetic analysis in R
phytools: Provides functions for phylogenetic tree manipulation, including midpoint rooting and Pagel’s lambda calculation
geiger: Implements model fitting for discrete character evolution with AIC model selection
ggtree: Creates publication-quality phylogenetic tree visualizations
Statistical Analysis#
vegan: Implements PERMANOVA and other ecological statistical methods
dplyr/tidyr: Data manipulation for statistical analysis
stats: Core R statistical functions used for association tests
pyseer: Python package integrated for population structure-aware association analysis
Visualization#
ComplexHeatmap/InteractiveComplexHeatmap: Creates sophisticated heatmap visualizations with interactive features
plotly: Generates interactive plots for web interfaces
ggplot2: Foundation for static data visualizations
DT: Interactive data tables for web display
Sequence Analysis#
Biostrings: Efficient handling of biological sequences
DECIPHER: Provides tools for sequence alignment visualization and analysis
The module integrates these packages with a Shiny web interface to create a seamless user experience for comparative genomic analysis.