GENOME_SELECTOR#
This module is a part of metaFun pipeline, designed to help researchers select and filter genomes for downstream comparative analysis. This guide provides detailed explanations of each component in the interface, helping you make the most of its features.

Overview#
The GENOME_SELECTOR module provides an interactive web interface for selecting and filtering metagenome-assembled genomes (MAGs) based on quality metrics, taxonomic classification, and sample metadata. It enables researchers to visualize genome quality metrics, explore taxonomic distributions, and make informed selections for downstream comparative analysis in the COMPARATIVE_ANNOTATION module.
Module Execution#
# Basic usage
(metafun) metafun -module GENOME_SELECTOR -i combined_metadata_quality_taxonomy_*.csv

# Specify a different port for the web interface
(metafun) metafun -module GENOME_SELECTOR -i combined_metadata_quality_taxonomy_*.csv -p 8888
Module Operation Sequence#
This module performs the following steps:
Loads and processes the input metadata file (from BIN_ASSESSMENT module)
Extracts quality metrics, taxonomic information, and sample metadata
Launches an interactive web interface for data exploration and genome selection
Provides visualization tools for quality assessment and taxonomic distribution
Enables filtering and selection of genomes based on multiple criteria
Exports selected genomes to a CSV file for downstream analysis
Parameters#
${launchDir} is the directory where you execute metaFun, and utilized as output base directory.
Parameter |
Description |
Default Value |
Note |
|---|---|---|---|
|
Input metadata file with genome quality and taxonomy information |
Required |
Typically the combined_metadata_quality_taxonomy_*.csv file from BIN_ASSESSMENT module |
|
Port number for the web interface |
|
Optional, can be changed if the default port is in use |
|
Output directory for saving results |
|
Default is the launch directory |
Inputs and Outputs#
Inputs#
Combined metadata file containing genome quality metrics, taxonomic classification, and sample metadata
This file is generated by the BIN_ASSESSMENT module (combined_metadata_quality_taxonomy_*.csv)
Input file should contain columns for genome names, completeness, contamination, quality scores, taxonomic classification, and sample metadata
Outputs#
CSV file containing the selected genomes and their associated metadata
Default output filename:
genome_selector_result.csvThis file serves as input for the COMPARATIVE_ANNOTATION module
Output directory structure#
The output file is saved in the launch directory (or the directory specified with -o):
${launchDir}/
└── genome_selector_result.csv    # Contains selected genomes and their metadata
Usage Notes#
The GENOME_SELECTOR module is designed to work with the output from the BIN_ASSESSMENT module.
For optimal visualization and analysis, it is recommended to use a combined metadata file that includes sample information.
The web interface automatically adapts to the available metadata columns in your input file.
Selected genomes are saved in a format that is directly compatible with the COMPARATIVE_ANNOTATION module.
You can save your selection both locally and on the server where metaFun is running.
Command-line Filtering with awk
In addition to the interactive interface, you can also filter genomes using command-line tools like awk. This approach is useful for quick filtering based on specific criteria or for automating genome selection:
# Filter genomes with completeness > 90% and save to a new file
awk -F ',' 'NR==1 || ($2 > 90)' combined_metadata_quality_taxonomy_*.csv > high_completeness_genomes.csv

# Filter genomes with contamination < 5%
awk -F ',' 'NR==1 || ($3 < 5)' combined_metadata_quality_taxonomy_*.csv > low_contamination_genomes.csv

# Combined filtering: completeness > 90% AND contamination < 5%
awk -F ',' 'NR==1 || ($2 > 90 && $3 < 5)' combined_metadata_quality_taxonomy_*.csv > high_quality_genomes.csv

# Filter specific taxonomy (e.g., genomes containing "Bacteroidota" in their classification)
awk -F ',' 'NR==1 || $NF ~ /Bacteroidota/' combined_metadata_quality_taxonomy_*.csv > bacteroidota_genomes.csv

# Extract only genome names that meet quality criteria (useful for downstream processing)
awk -F ',' '($2 > 80 && $3 < 10) {print $1}' combined_metadata_quality_taxonomy_*.csv > selected_genome_names.txt
These command-line approaches can complement the GENOME_SELECTOR interface, especially for batch processing or integrating with custom scripts.
Next Steps#
After selecting genomes of interest with this module, proceed to COMPARATIVE_ANNOTATION to:
Perform comprehensive annotation of selected genomes
Conduct comparative genomic analyses
Generate functional profiles
Compare genomes across different samples or conditions
The interface components and data processing features described in the sections below provide detailed guidance on using the interactive web interface for genome selection.
Interface Components#
Section 1: General Overview and Metadata Selection#

① Select your metadata dropdown: Choose which metadata attribute to visualize in the scatter plot. This helps you identify patterns by coloring data points according to the selected attribute.
② Select taxonomy rank dropdown: Choose which taxonomic level (domain, phylum, class, etc.) to use for filtering genomes.
③ Select taxonomy values dropdown: Once a taxonomic rank is selected, this dropdown allows you to select specific values within that rank to filter the data.
Note
The metadata selection (dropdown ①) and taxonomy selection (dropdowns ② and ③) are independent choices. You can select any combination of metadata attribute and taxonomic filters to customize your visualization and analysis.
④ Scatter Plot of Genome Quality: This visualization shows the relationship between completeness (x-axis) and contamination (y-axis) of genomes. Points are colored according to the metadata selected in dropdown ①. The color scale represents the numerical value of the selected metadata, with higher values displayed in yellow/green and lower values in purple/blue.
⑤ Plot of Selected Metadata: Displays the distribution of the selected metadata attribute across all genomes as a histogram, helping you understand the overall data composition and identify patterns or outliers.
Section 2: Taxonomic Exploration and Genome Selection#
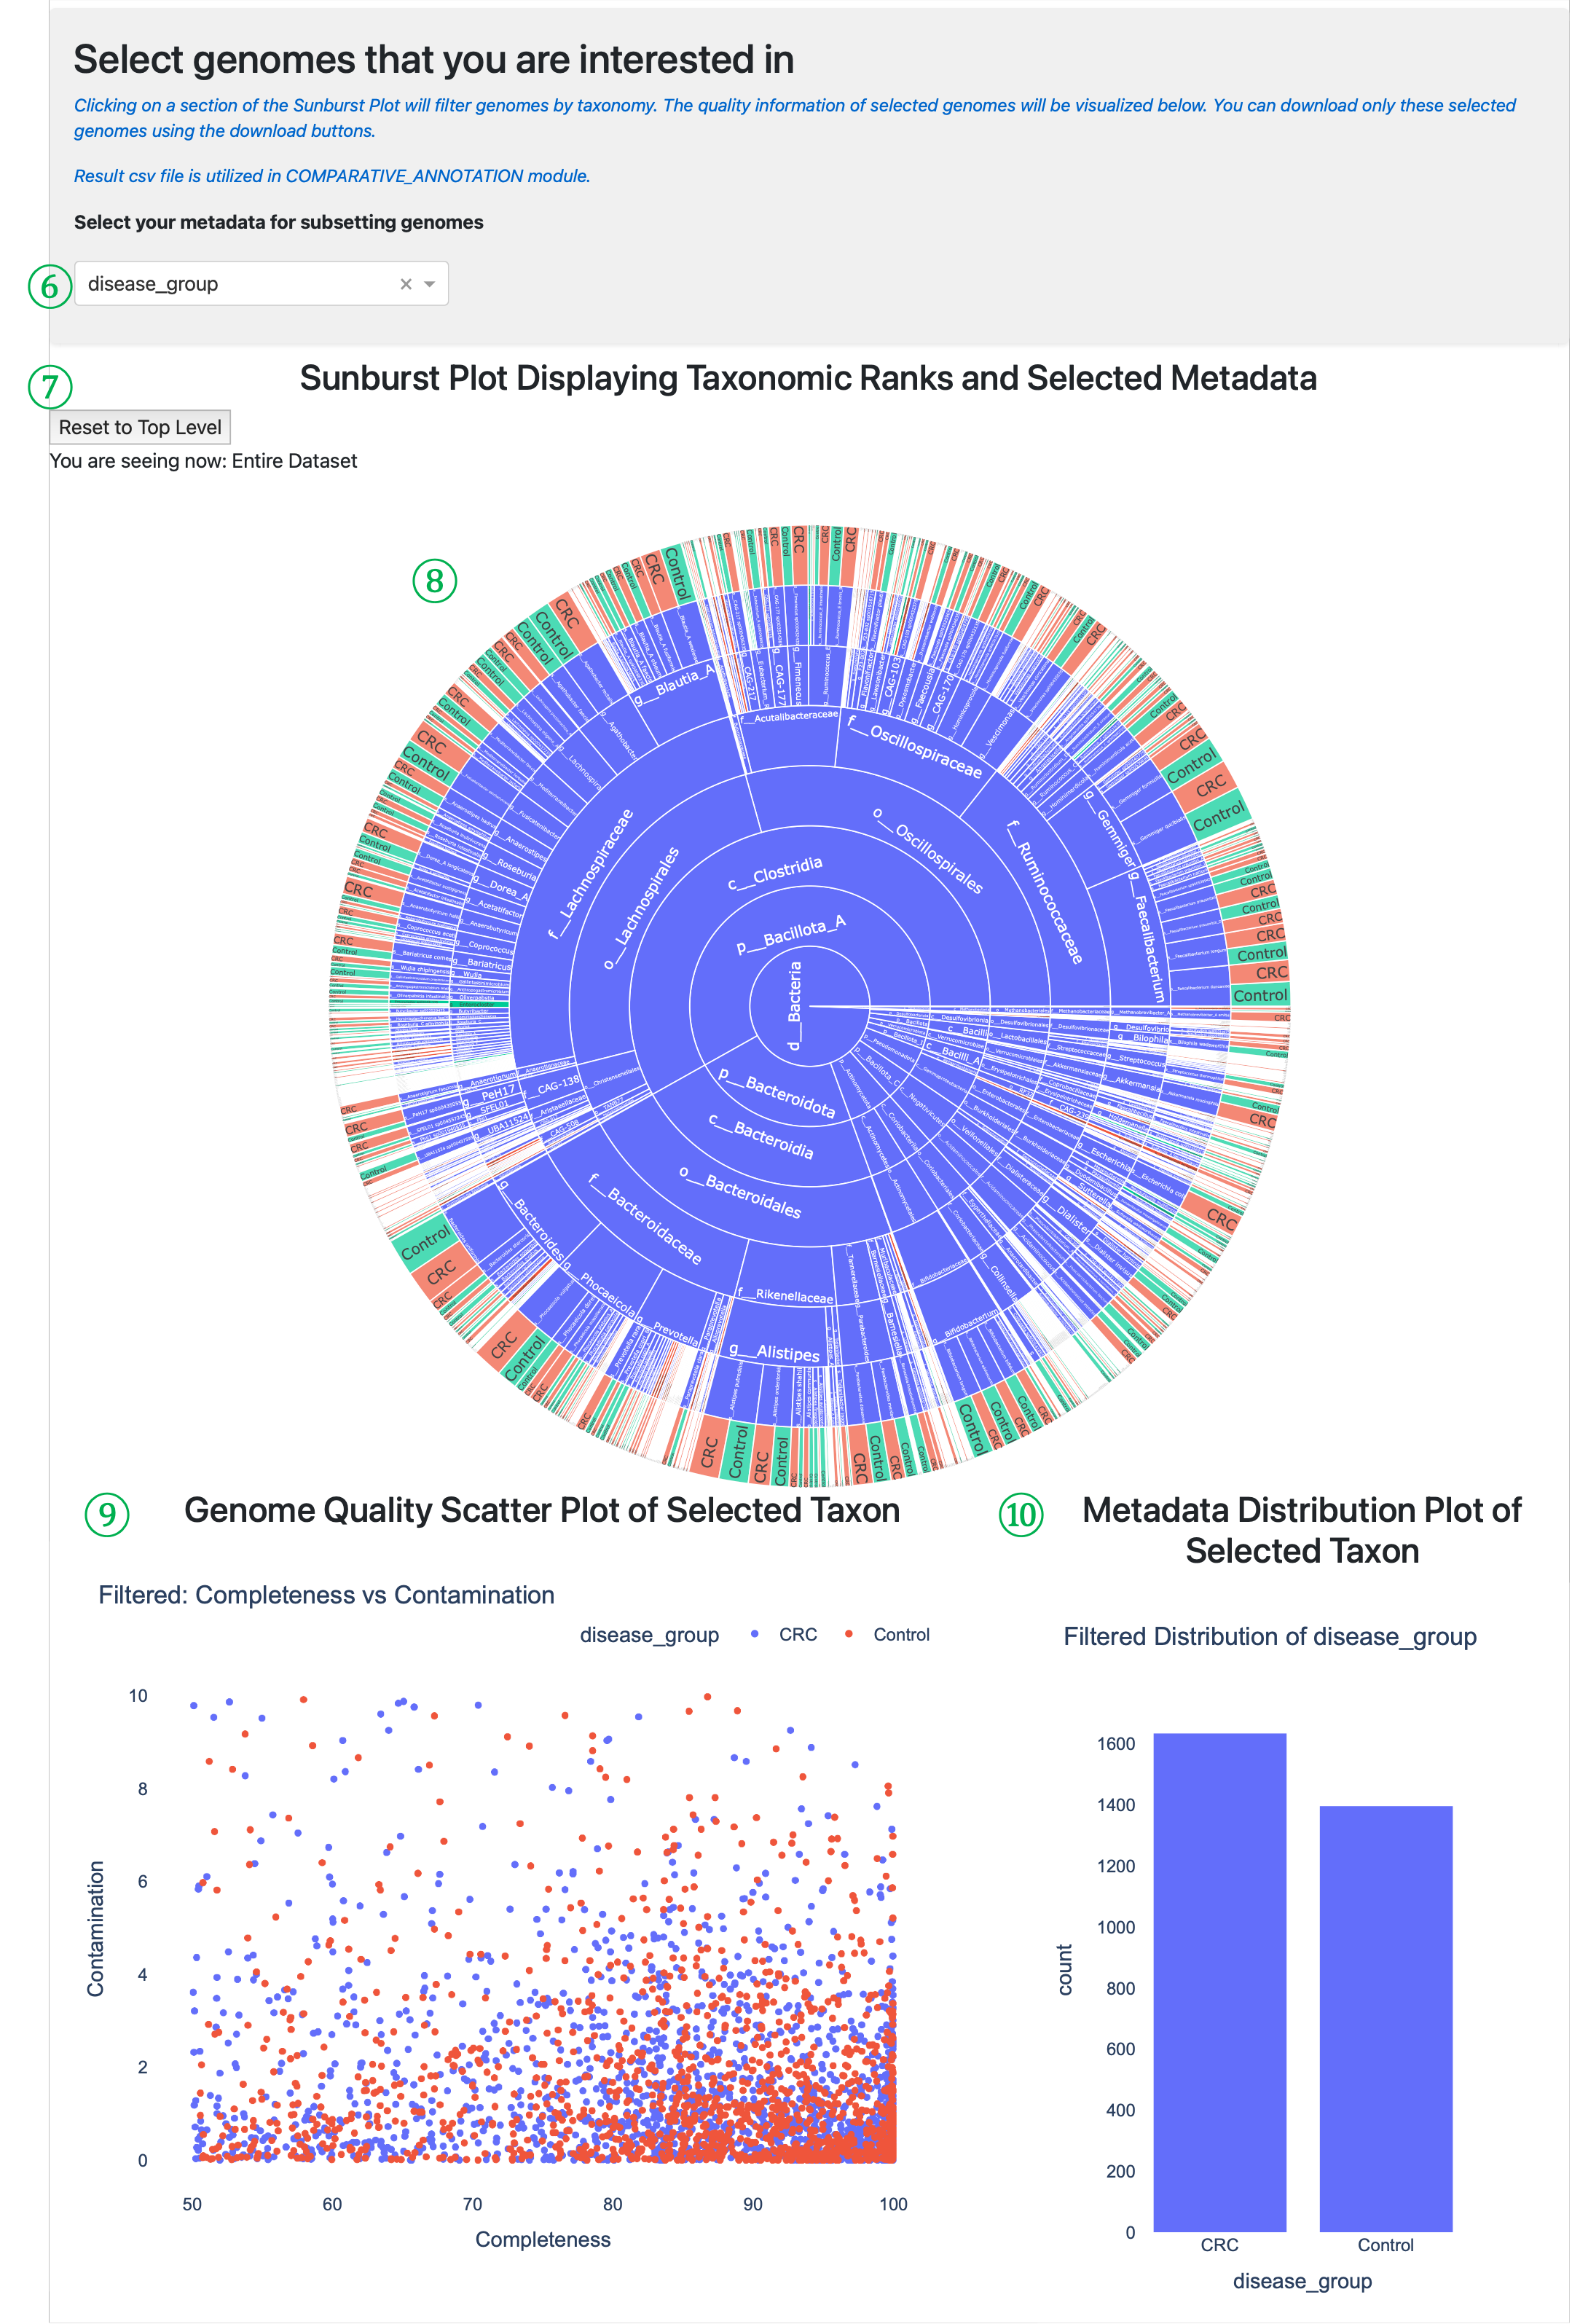
⑥ Metadata selection for subsetting: Choose which metadata attribute to visualize in the sunburst plot. The script automatically detects whether the selected metadata is numerical or categorical and adapts the visualization accordingly.
⑦ Sunburst navigation tools: Contains the Reset to Top Level button to return to the full dataset view and displays your current position in the taxonomic hierarchy (“You are seeing now: Entire Dataset” or specific path).
⑧ Sunburst Plot: Interactive visualization displaying taxonomic hierarchy and selected metadata. The concentric rings represent taxonomic levels (domain → phylum → class → order → family → genus → species). Clicking on sections filters genomes by taxonomy and updates the plots below. You can click any section and can identify the metadata value distribution of species genomes.
⑨ Filtered Scatter Plot: Shows completeness vs. contamination for only the genomes that match your current taxonomic selection from the sunburst plot. This allows you to evaluate genome quality with your selected taxonomic groups and metadata.
⑩ Filtered Distribution Plot: Displays the distribution of selected metadata values for only the genomes matching your current taxonomic selection, helping you understand how metadata values are distributed within specific taxonomic groups.
Section 3: Data Export and Download#
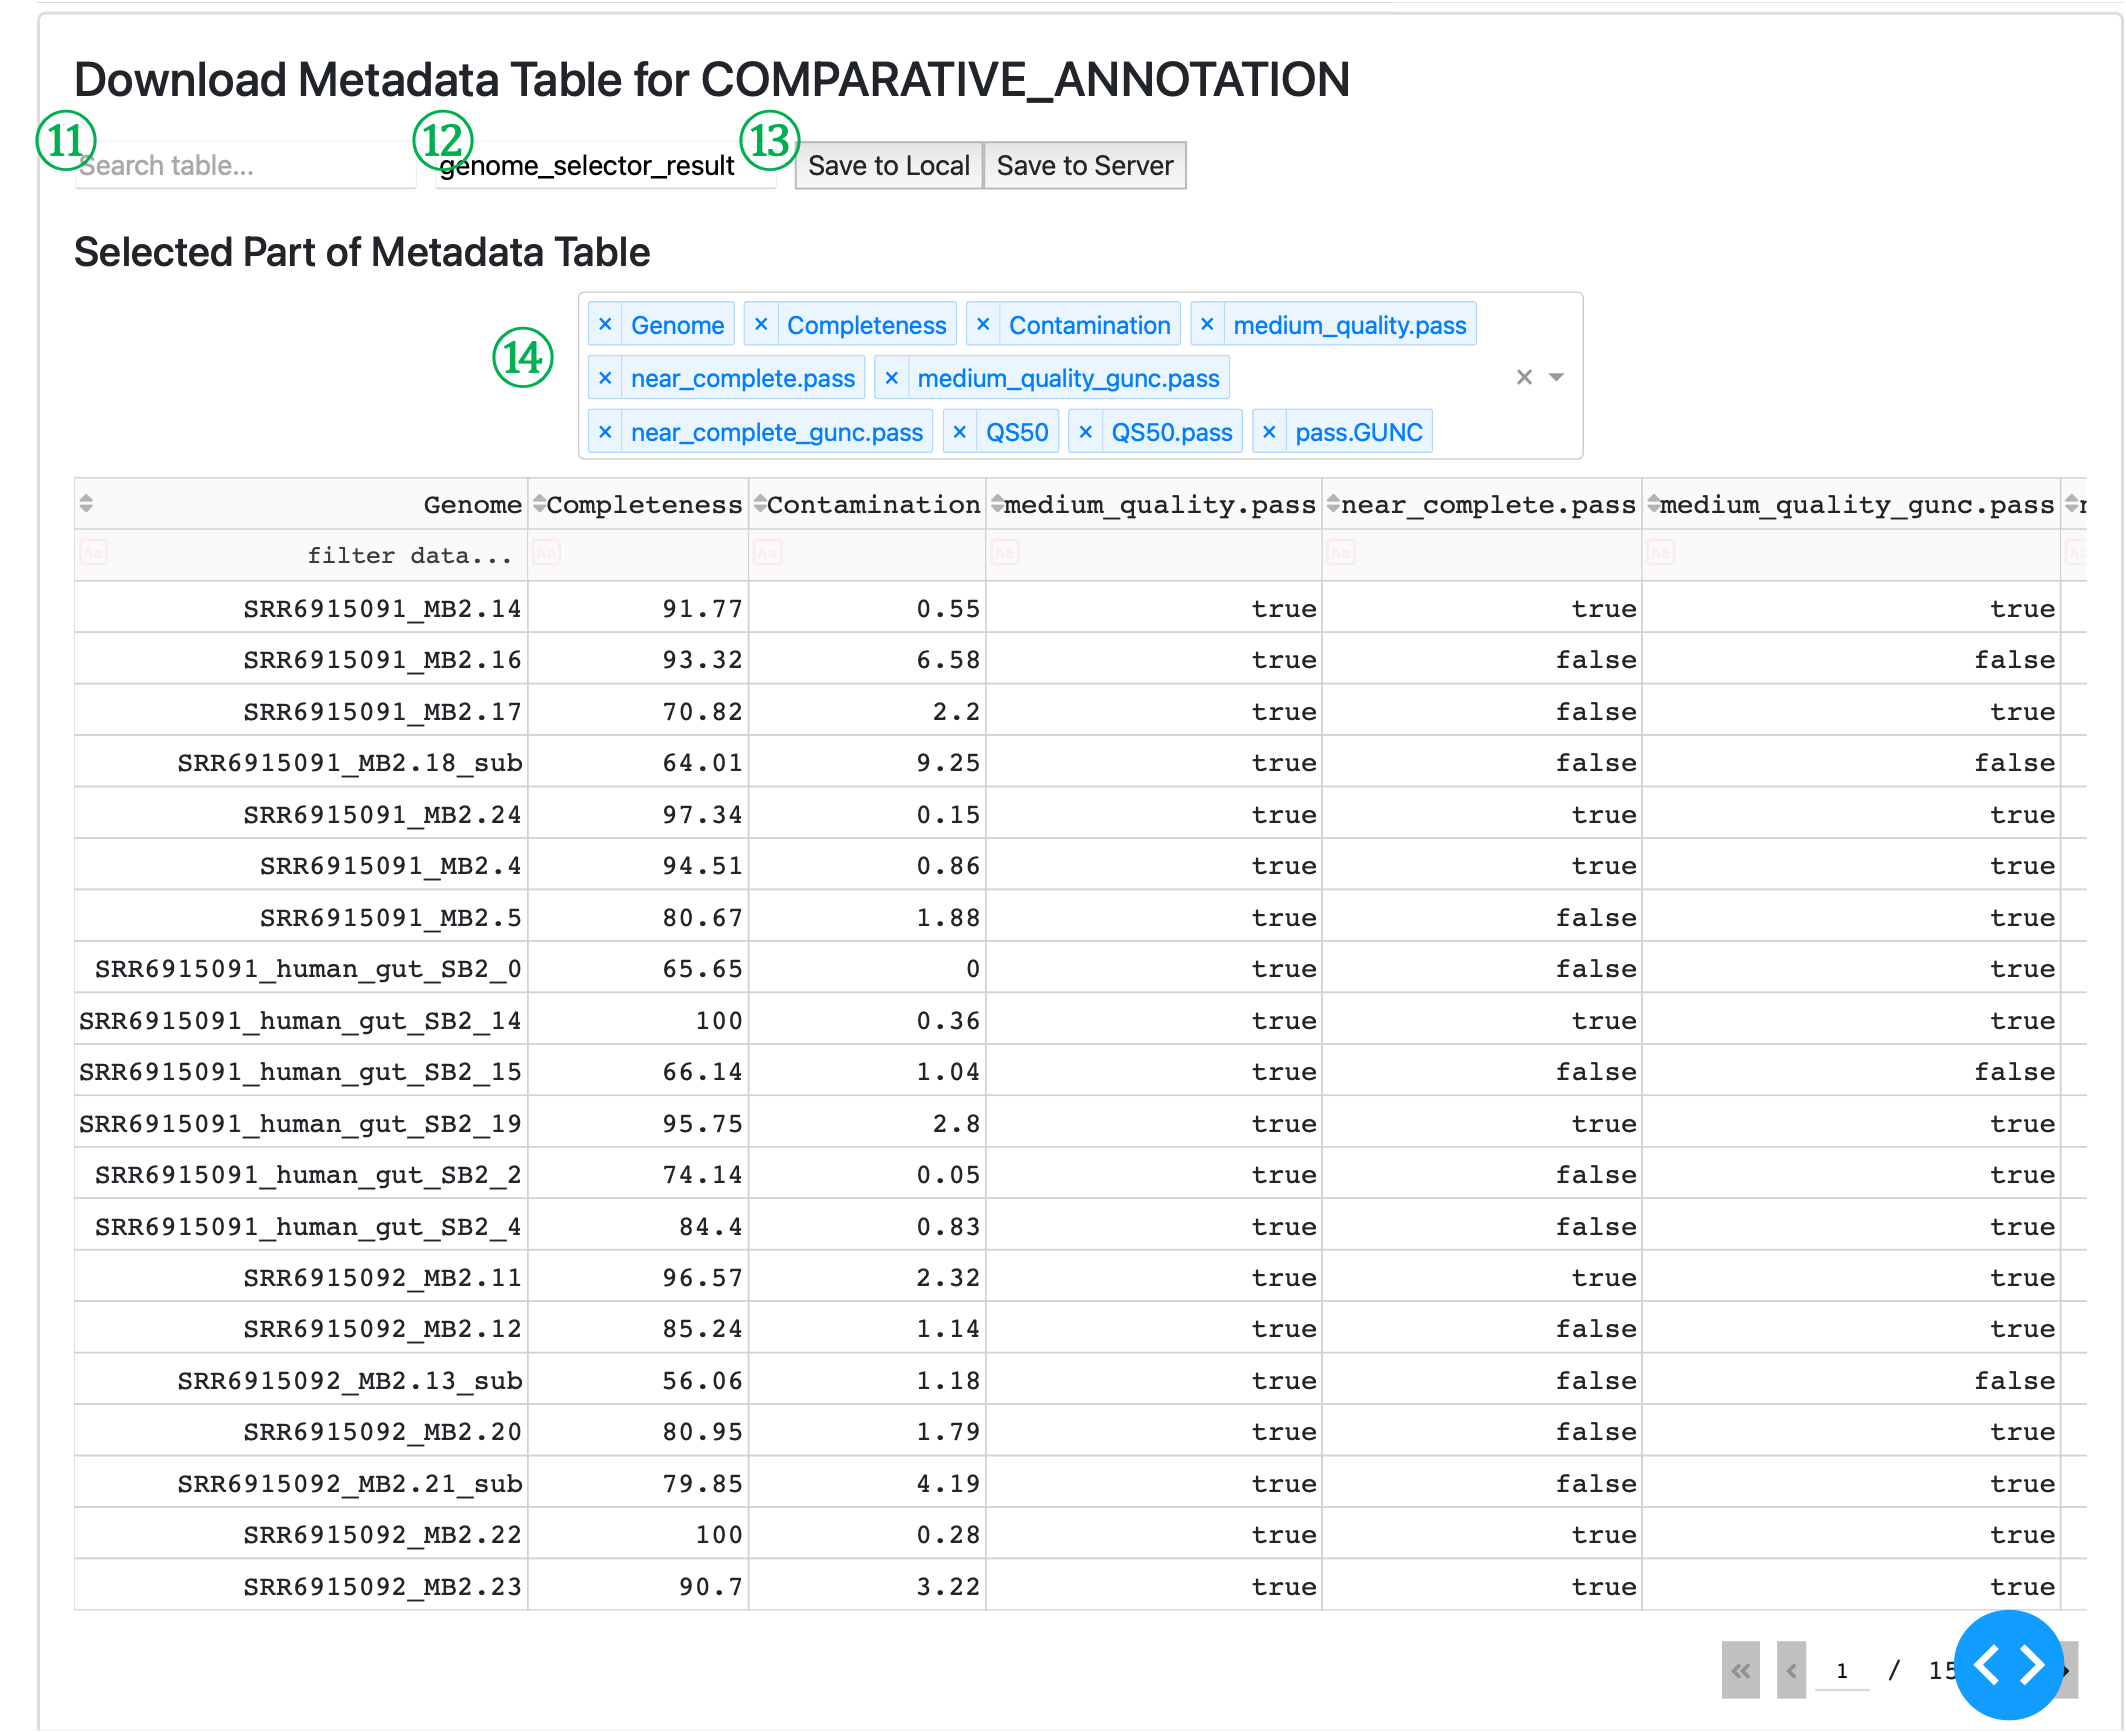
⑪ Search table input: Allows you to search for specific terms within the data table, helping you locate particular genomes of interest by any text field.
⑫ Filename input: Specify the name for your output CSV file that will be used in the COMPARATIVE_ANNOTATION module. Default value is “genome_selector_result” and it will be saved into ${launch_dir} as genome_selector_result.csv.
⑬ Export buttons: - “Save to Local” downloads the filtered genome table to your local machine. - “Save to Server” saves the file on the server where metaFun is running, allowing direct access by the COMPARATIVE_ANNOTATION module.
⑭ Column selector dropdown: Choose which columns to display in the table view. This helps focus on relevant information without affecting the data being exported, which will contain all columns from the original dataset.
Data Processing Features#
The Genome Selector performs several important data processing tasks:
Automatic data type detection: The script determines whether selected metadata is numerical or categorical and adapts visualizations accordingly
Missing value handling: Missing values (shown as “None”) are properly handled in visualizations and filtered when necessary
Taxonomy visualization: The sunburst plot automatically organizes data by taxonomic hierarchy for intuitive exploration
Interactive filtering: Every selection in the interface updates all plots and tables dynamically
Data export: Selected genomes can be exported with all their original metadata for use in downstream analyses
Best Practices for Genome Selection#
Start by exploring the overall distribution of genomes using different metadata attributes
Use the taxonomy filters to narrow down to specific groups of interest
Pay attention to both completeness and contamination values when selecting genomes
Use the sunburst plot to understand the taxonomic diversity of your generated MAGs
Export selected genomes using a descriptive filename for easy identification later
This interface provides a comprehensive way to explore and select high-quality genomes for comparative genomic analysis in the metaFun pipeline.