WMS_TAXONOMY#
 This module is a part of metaFun pipeline, designed for taxonomic analysis of whole metagenome sequencing data using Kraken2, Bracken, and Sylph.
Overview#
The WMS_TAXONOMY module performs taxonomic classification and abundance estimation from whole metagenome sequencing data. It utilizes Kraken2 for fast taxonomic classification based on k-mer matching, Bracken for improved abundance estimation at the species level, and optionally Sylph for ultra-fast taxonomic profiling. The module integrates taxonomic profiles with sample metadata to create Phyloseq objects for downstream statistical analysis and visualization.
Module Execution#
# Basic usage with Sylph (default profiler)
(metafun) metafun -module WMS_TAXONOMY -i results/metagenome/RAWREAD_QC/read_filtered -m metadata.csv --sampleIDcolumn 1

# Use Kraken2/Bracken instead of Sylph
(metafun) metafun -module WMS_TAXONOMY -i results/metagenome/RAWREAD_QC/read_filtered -m metadata.csv --sampleIDcolumn 1 --profiler kraken2

# Include statistical analysis based on metadata column
(metafun) metafun -module WMS_TAXONOMY -i results/metagenome/RAWREAD_QC/read_filtered -m metadata.csv --sampleIDcolumn 1 --analysiscolumn 2

# Use short argument forms
(metafun) metafun -module WMS_TAXONOMY -i results/metagenome/RAWREAD_QC/read_filtered -m metadata.csv -c 1 -a 2

# Use memory-mapping for improved Kraken2 performance
(metafun) metafun -module WMS_TAXONOMY -i results/metagenome/RAWREAD_QC/read_filtered -m metadata.csv --sampleIDcolumn 1 --profiler kraken2 --kraken_method memory-mapping
Module Operation Sequence#
This module performs the following steps:
Taxonomic classification using Sylph (default) or Kraken2:
Sylph: Creates sketches and profiles reads against GTDB database
Kraken2: Maps k-mers from reads to taxonomic labels using GTDB database
Abundance estimation with Bracken (when using Kraken2):
Improves species-level abundance estimates from Kraken2 results
Filters results based on relative abundance threshold
Phyloseq object creation:
Combines taxonomic profiles with metadata
Creates R-compatible objects for statistical analysis
Statistical analysis (optional):
Alpha diversity analysis
Beta diversity ordination
Differential abundance testing
Parameters#
${launchDir} is the directory where you execute metaFun, and utilized as output base directory.
Parameter |
Description |
Default Value |
Note |
|---|---|---|---|
|
Input directory containing filtered reads |
|
Required. Output from RAWREAD_QC workflow |
|
Path to metadata file |
None |
Required. CSV file with sample information |
|
Column number for sample IDs in metadata |
|
Required. Matches sample IDs in read filenames |
|
Column number for analysis grouping |
|
Optional. If set to 0, no statistical analysis is performed |
|
Taxonomic profiler to use |
|
Optional. Options: |
|
Kraken2 method |
|
Optional. Options: |
|
Confidence threshold for Kraken2 |
|
Optional. Higher values = more specific classifications |
|
Relative abundance filter for Bracken results |
|
Optional. Filter out species below this threshold |
|
Abundance type for Sylph output |
|
Optional. Type of abundance values to report |
|
Number of CPUs to use |
|
Optional. Adjust based on your system capabilities |
|
Output directory |
|
Optional. Where results will be saved |
Inputs and Outputs#
Inputs#
Quality-controlled paired-end metagenomic reads (output from RAWREAD_QC workflow)
Metadata file (CSV format) with sample information and conditions
Outputs#
Kraken2 classification reports
Bracken abundance estimates (if using Kraken2)
Sylph profiling results (if using Sylph)
Phyloseq object (RDS file) for statistical analysis
Statistical analysis results and visualizations (if –analysiscolumn is specified)
Output directory structure#
The output is organized in the following directory structure:
${launchDir}/results/metagenome/WMS_TAXONOMY/
├── kraken2/                          # Kraken2 classification results
│   ├── ${sample_id}_kraken2.report    # Classification reports for each sample
│   └── ...
├── bracken/                          # Bracken abundance estimation results
│   ├── ${sample_id}_bracken.out       # Abundance estimates for each sample
│   └── ...
├── sylph/                            # Sylph profiling results (if selected)
│   ├── ${sample_id}.paired.sylsp      # Sylph sketches for each sample
│   ├── all.profile-sylph.tsv         # Combined Sylph profile
│   ├── merged_sylph_species.tsv      # Merged species abundance table
│   └── ...
├── phyloseq/                         # Phyloseq objects
│   ├── phyloseq_object.RDS           # For Kraken2/Bracken results(if used)
│   ├── phyloseq_object_sylph.RDS     # For Sylph results
│   └── ...
└── stats_analysis/                   # Statistical analysis results
    ├── alpha_diversity/              # Alpha diversity measures and plots
    ├── beta_diversity/               # Ordination plots and PERMANOVA results
    ├── differential_abundance/       # Differential abundance test results
    └── ...
Execution Examples and Results#
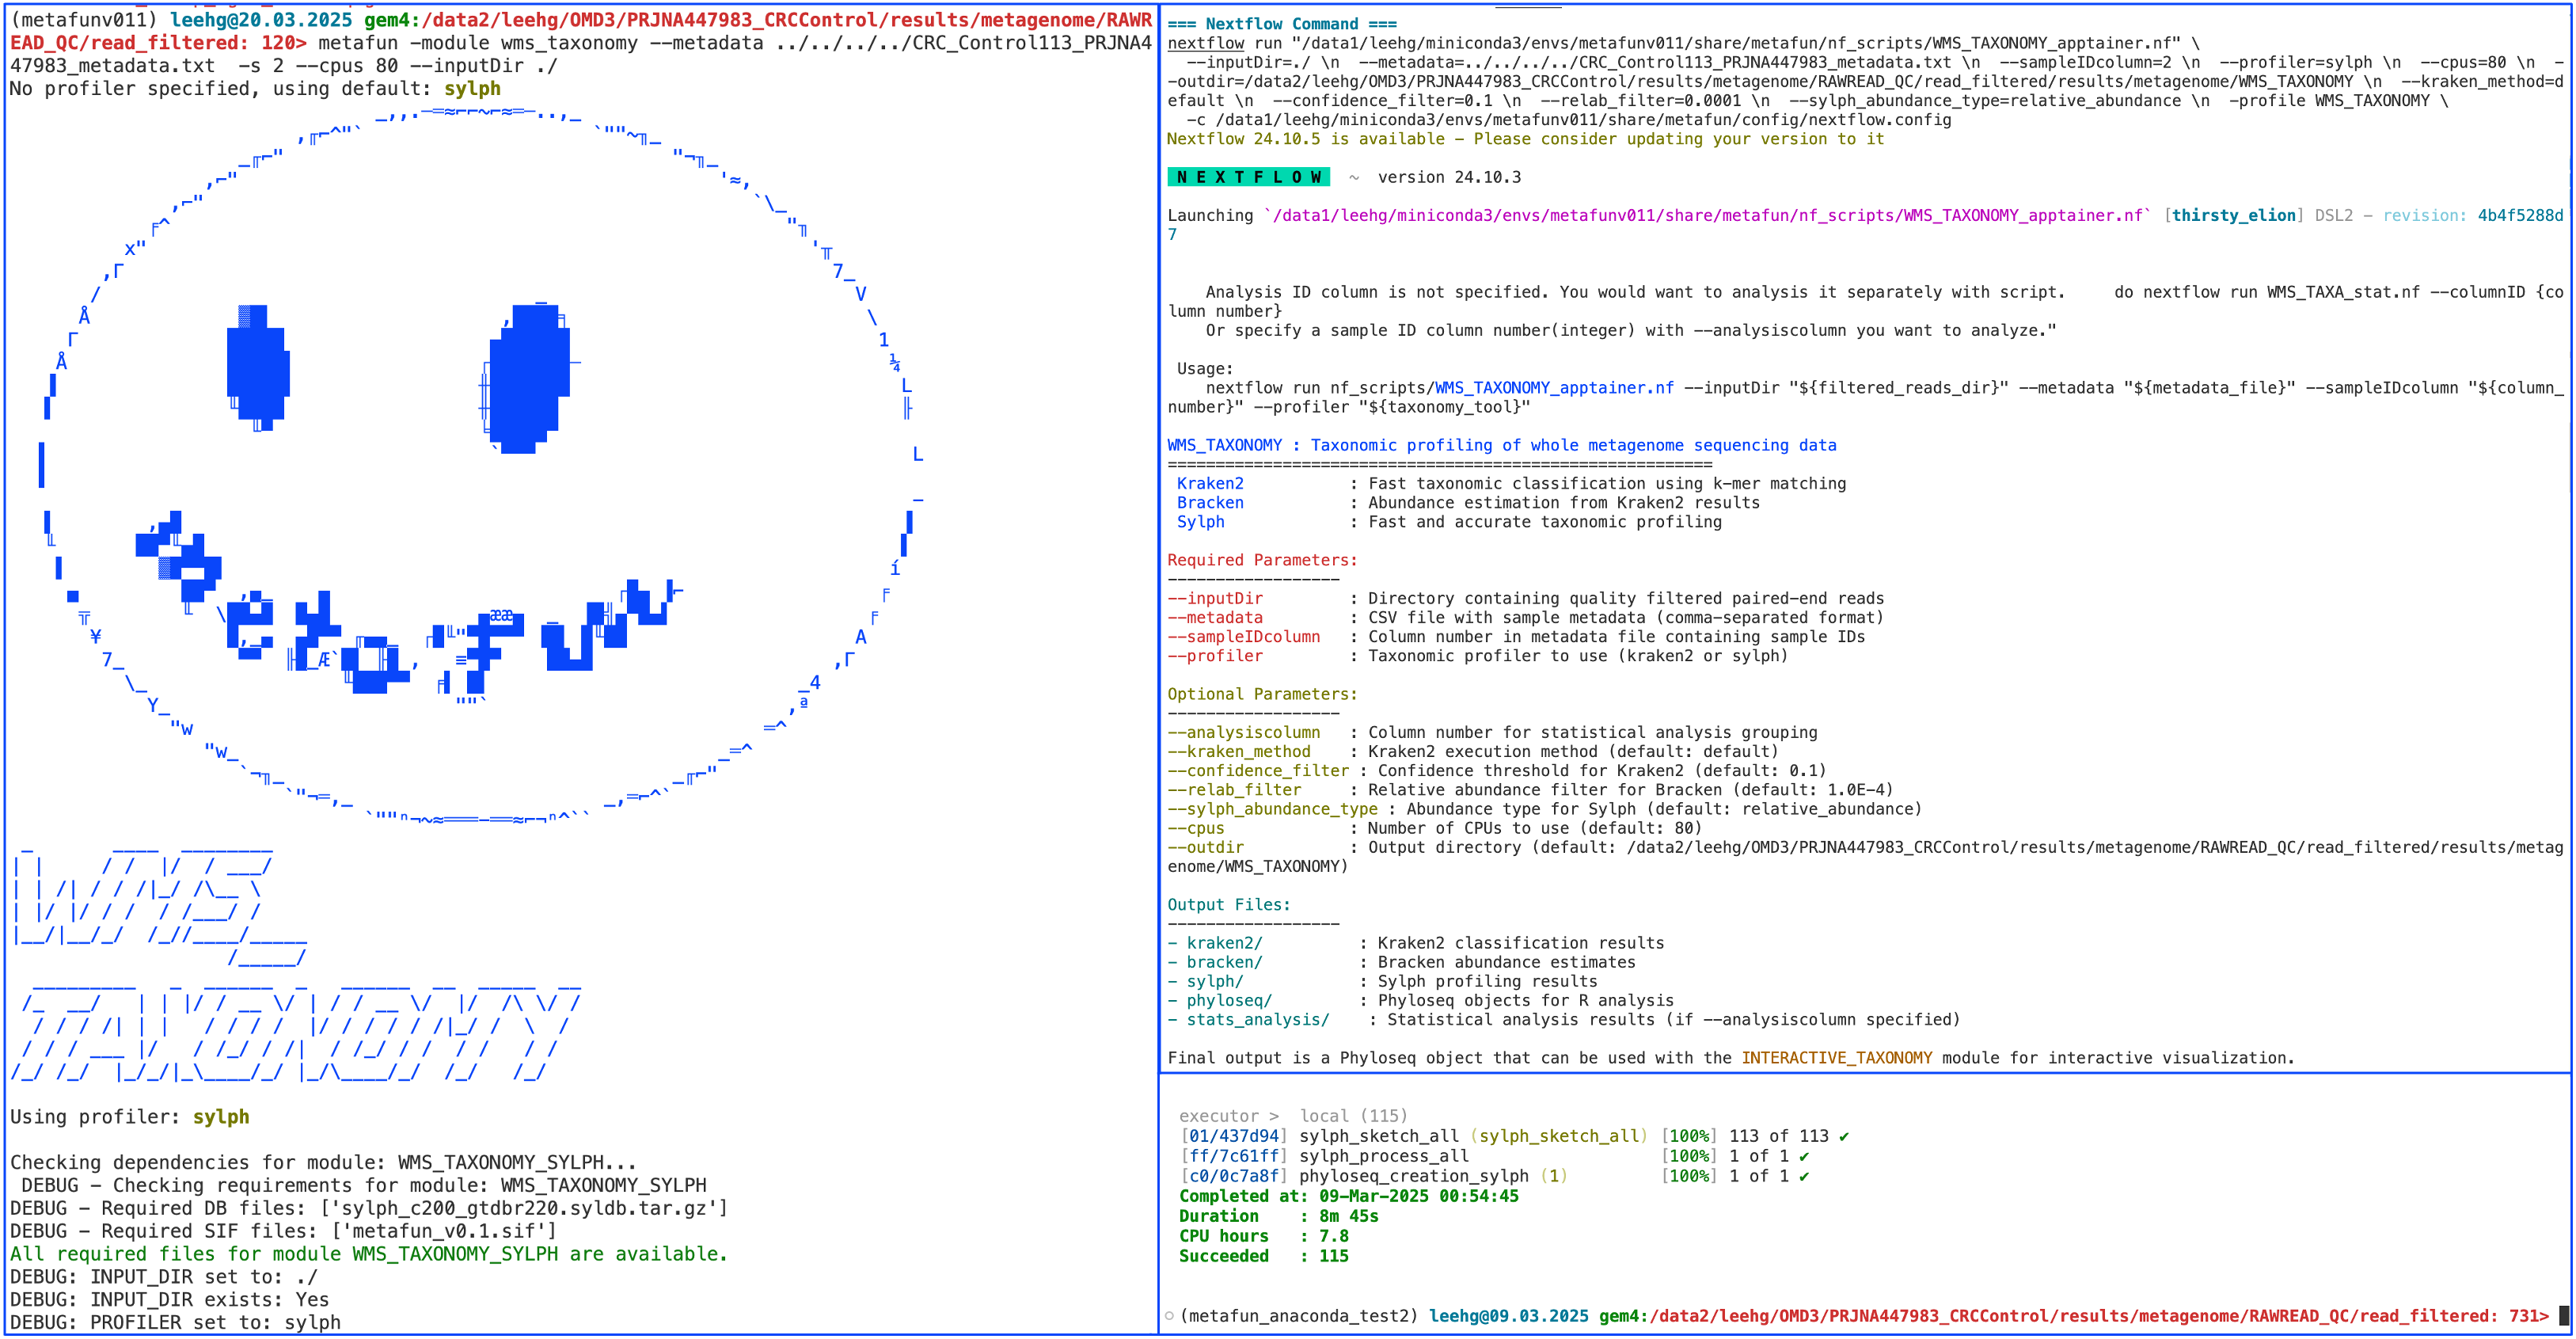
metaFun command line execution example#
Example of Kraken2 output#
$ head -n 10 ${launchDir}/results/metagenome/WMS_TAXONOMY/kraken2/SRR6915091_kraken2.report

100.00  3652288 3652288 U       0       unclassified
0.00    0       0       R       1       root
0.00    0       0       R1      131567  cellular organisms
0.00    0       0       D       2157    Archaea
0.00    0       0       D       2       Bacteria
0.00    0       0       P       1224    Pseudomonadota
0.00    0       0       C       28211   Alphaproteobacteria
0.00    0       0       O       356     Hyphomicrobiales
0.00    0       0       F       41294   Bradyrhizobiaceae
0.00    0       0       G       1073    Rhodopseudomonas
Example of Bracken output#
$ head -n 10 ${launchDir}/results/metagenome/WMS_TAXONOMY/bracken/SRR6915091_bracken.out

name                                                            taxonomy_id     taxonomy_lvl     kraken_assigned_reads        added_reads     new_est_reads   fraction_total_reads
Bacteroides vulgatus                                            435590          S                62479                        3214            65693           0.01798
Faecalibacterium prausnitzii                                    853                S                41682                        2143            43825           0.01199
Prevotella copri                                                418267          S                38769                        1993            40762           0.01116
Bacteroides uniformis                                           820                S                23683                        1218            24901           0.00682
Blautia obeum                                                   40520           S                22395                        1151            23546           0.00644
Agathobacter rectale                                            39491           S                22009                        1131            23140           0.00633
Bacteroides dorei                                               338188          S                20912                        1075            21987           0.00602
Bacteroides stercoris                                           46506           S                20614                        1060            21674           0.00593
Clostridium bolteae                                             208479          S                18229                        937             19166           0.00525
Nextflow Processes in WMS_TAXONOMY Module#
Process |
InputDir |
OutputDir |
Note |
|---|---|---|---|
kraken2_run |
|
|
Performs taxonomic classification using Kraken2 |
bracken_run |
Output from kraken2_run |
|
Estimates abundances using Bracken |
sylph_sketch_all |
|
|
Creates Sylph sketches from reads |
sylph_process_all |
Output from sylph_sketch_all |
|
Processes Sylph sketches and generates taxonomic profiles |
phyloseq_creation |
Output from bracken_run |
|
Creates Phyloseq object from Bracken results |
phyloseq_creation_sylph |
Output from sylph_process_all |
|
Creates Phyloseq object from Sylph results |
statistical_analysis |
Output from phyloseq_creation or phyloseq_creation_sylph |
|
Performs statistical analyses if –analysiscolumn is specified |
Descriptions of Processes in WMS_TAXONOMY Workflow#
kraken2_run: Classifies metagenomic reads using Kraken2, a k-mer based taxonomic classifier.
Input: Paired-end quality-filtered metagenomic reads
Output: Kraken2 classification reports for each sample
Uses GTDB database for taxonomic assignment
Can use memory-mapping for improved performance
bracken_run: Estimates species abundances from Kraken2 results using Bracken.
Input: Kraken2 reports
Output: Bracken abundance estimates for each sample
Automatically determines appropriate read length for Bracken database
Filters results based on relative abundance threshold
sylph_sketch_all: Creates compressed sketches of metagenomic reads using Sylph.
Input: Paired-end quality-filtered metagenomic reads
Output: Sylph sketches (.sylsp files) for each sample
Fast alternative to Kraken2 for taxonomic profiling
sylph_process_all: Processes Sylph sketches to generate taxonomic profiles.
Input: Sylph sketches from all samples
Output: Combined Sylph profiles and species abundance tables
Converts profiles to format compatible with taxonomic analysis
phyloseq_creation: Creates a Phyloseq object from Bracken results.
Input: Bracken abundance files and metadata
Output: Phyloseq object in RDS format
Integrates taxonomic and sample metadata for analysis in R
phyloseq_creation_sylph: Creates a Phyloseq object from Sylph results.
Input: Merged Sylph species abundance table and metadata
Output: Phyloseq object in RDS format for Sylph results
Similar to phyloseq_creation but processes Sylph-specific formats
statistical_analysis: Performs statistical analyses on taxonomic profiles.
Input: Phyloseq object
Output: Alpha diversity, beta diversity, and differential abundance results
Only runs if –analysiscolumn is specified
Tools Used in WMS_TAXONOMY#
Tool |
Purpose |
Version |
Default parameters |
Parameters that can be selected |
|---|---|---|---|---|
Kraken2 |
Taxonomic classification |
2.1.2 |
|
|
Bracken |
Abundance estimation |
2.7 |
|
|
Sylph |
Fast taxonomic profiling |
0.6.1 |
|
None specific to this workflow |
R (phyloseq) |
Statistical analysis and visualization |
4.3.2 |
N/A |
N/A |
Usage Notes#
The WMS_TAXONOMY module is designed to work with the output from the RAWREAD_QC module.
Metadata file should be in CSV format with at least one column containing sample IDs that match the prefixes of your read filenames.
For large datasets, using
--kraken_method memory-mappingcan significantly improve performance, but requires sufficient system memory.The relative abundance filter (
--relab_filter) can be adjusted to control the sensitivity of species detection - lower values include rarer species.Sylph profiler (
--profiler sylph) provides much faster taxonomic profiling than Kraken2/Bracken and can be a good alternative for large datasets.The Phyloseq object created by this module can be used with other R packages for custom analysis or with the INTERACTIVE_WMS_TAXONOMY module.
Important abundance estimation differences: The two profilers included in this module use fundamentally different approaches:
Sylph estimates taxonomic abundance based on whole-genome matching to reference sequences and Kraken2 with Bracken estimates sequence abundance (read counts) by assigning individual reads to taxa and adjusting for database biases(doi: 10.1038/s41592-021-01141-3)
These differences should be considered when comparing results between profilers or when combining with other analytical methods
Next Steps#
After running WMS_TAXONOMY, you can:
Explore the results interactively using the INTERACTIVE_WMS_TAXONOMY module:
(metafun) metafun -module INTERACTIVE_WMS_TAXONOMY -i results/metagenome/WMS_TAXONOMY
Interactive analysis flexibility
The INTERACTIVE_WMS_TAXONOMY module allows you to:
Point directly to the WMS_TAXONOMY output directory containing phyloseq objects using the
-iparameterPerform metadata-based analyses even if you didn’t specify
--analysiscolumnin the WMS_TAXONOMY runSelect different metadata variables for analysis on-the-fly, without rerunning taxonomic classification
Visualize and test taxonomic patterns interactively across any metadata variable in your dataset
Perform deeper analysis by:
Examining specific taxonomic groups of interest
Comparing taxonomic compositions across different conditions
Correlating taxonomic profiles with metadata variables
Identifying biomarkers for specific conditions
The WMS_TAXONOMY module provides a solid foundation for taxonomic analysis of metagenomic data, enabling researchers to understand the microbial composition of their samples and identify taxonomic signatures associated with different conditions.